Winter 2021/2022 recap: Fuel prices drove high energy costs in New England; grid operated reliably amid mild weather

New England’s power system operated reliably through the winter of 2021/2022 as mild weather prevailed and supply chain issues that were a concern ahead of the season did not limit the availability of fuel for the region’s generators.
High global fuel prices, and regional natural gas prices that approached record levels in January, led to the second-most expensive winter in the history of the region’s wholesale electricity markets. Only the winter of 2013/2014, marked by cold weather that included a stretch of 10 consecutive days at or below freezing, saw a higher energy market value.
On the days this winter when cold did reign, global influences on natural gas pricing contributed to significantly more generation by oil-fired resources than in the winter of 2020/2021. This shift in the fuel mix—and an associated uptick in estimated carbon dioxide (CO2) emissions—was most evident in January, when 11% of the electricity produced in New England came from oil, compared to 0.2% in January 2021.
By the numbers
| Winter 2021-2022 | Winter 2020-2021 | Percent +/- | |
| Average Real-Time Electricity Price ($/megawatt-hour) | $105.48 | $51.66 | +104.2% |
| Average Natural Gas Price ($/MMBtu1) | $14.36 | $5.84 | +145.6% |
| Energy Market Value | $3.726 billion | $1.698 billion | +119.4% |
| Total Electricity Use | 32,682 GWh | 32,188 GWh | +1.5% |
Weather did not stress the grid
The ISO’s annual winter outlook, issued in early December 2021, warned that natural gas pipeline constraints, high fuel prices, and global supply chain issues related to deliveries of oil and liquefied natural gas (LNG) to New England could leave some power producers unable to operate. Under those circumstances, the outlook said, a prolonged cold snap could require the ISO to manage the grid through operating procedures up to and including controlled power outages.
Ultimately, the ISO’s most significant concerns entering the winter did not materialize, largely due to the following factors:
- The region did not see any arctic outbreaks or extended, bitter cold. While January and February saw a combined total of 14 days when the mean temperature was more than 10° Fahrenheit (F) below normal, those periods were often punctuated by warmer days. On the whole, the winter was about 1°F warmer than average.
- Some fuel replenishment did happen, despite the uncertainty of LNG and oil deliveries at the beginning of the winter. In addition to the LNG cargoes that were expected, three additional deliveries arrived.
Surplus generating capacity was available throughout the season and no emergency actions were implemented.
The ISO’s seasonal outlook predicted a winter peak of 19,710 megawatts (MW) during average weather conditions with a daily average temperature of 10°F. The actual peak was 19,729 MW on January 11 during the hour from 5 to 6 p.m., when the temperature in New England was 10°F. The region’s all-time winter peak record was set during a January 2004 cold snap, when electricity use reached 22,818 MW.
Wholesale electricity prices: A tale of two winters
While the winters of 2020/2021 and 2021/2022 were similar in terms of mild weather and total electricity use, wholesale electricity prices were significantly higher this winter.
The daily average price of natural gas more than doubled for the period of December through February compared to the previous winter, pushing wholesale electricity prices in the Real-Time and Day-Ahead energy markets to their highest winter averages of the past five years. The average real-time price of $105.48 was nearly 40% higher than the average price for the winter of 2017/2018, when natural gas prices were high and the region experienced a long cold snap.
Natural gas prices peaked this winter in January, rising above $20 per million British thermal units (MMBtu) for the first time in eight years. Power prices for the month in the Real-Time and Day-Ahead energy markets more than tripled compared to January 2021, averaging $148.66 and $149.46 per megawatt-hour (MWh), respectively.
The season’s high wholesale electricity prices produced an energy market value for the winter of 2021/2022 that, at over $3.7 billion, was twice the market value of the previous winter, and nearly four times the value for the winter of 2019/2020.
Fuel mix and emissions
Constraints on the natural gas pipeline system can limit the availability of fuel for natural gas-fired power plants during cold weather, as heating customers are served first through firm service contracts. When pipelines are constrained, the region relies more heavily on electricity generation from stored fuels—primarily LNG and oil.
LNG is a global commodity, and its availability and price in New England depends on worldwide demand.
Because New England’s energy markets select the lowest-priced resources to produce the electricity needed to meet consumer demand, oil-fired generators were dispatched more frequently during stretches of cold weather this winter as global LNG prices and high firm natural gas demand made natural-gas-fired generators more expensive to run. New England power plants burned about 80 million gallons of oil from December through February—more than three times the number of gallons burned in the previous three winters combined. About 90% of the oil burned this winter was consumed in January and early February, when temperatures were often below average. In January alone, oil-fired generators produced 4.5 times more electricity than they produced in all of 2021.
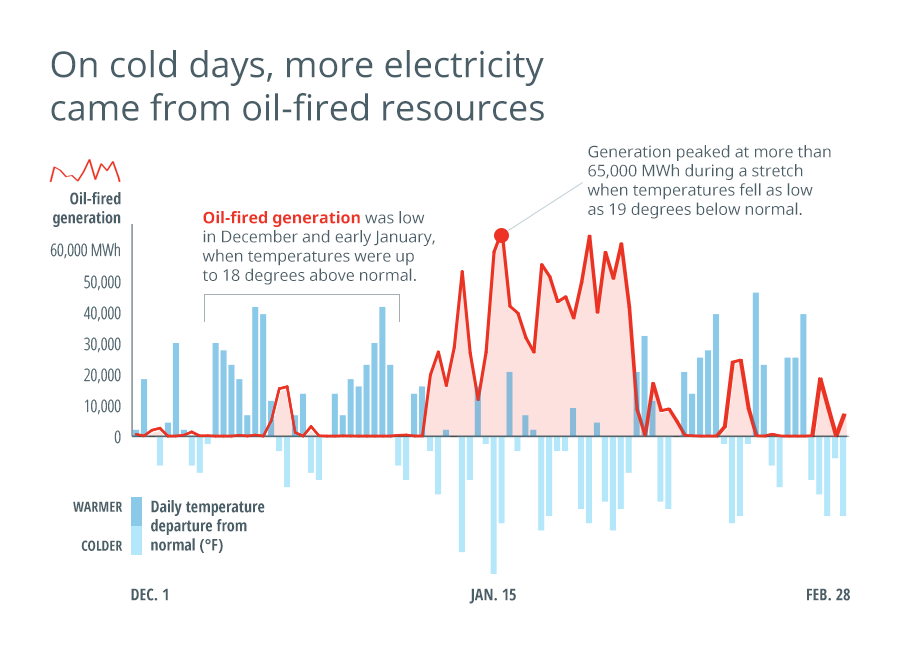
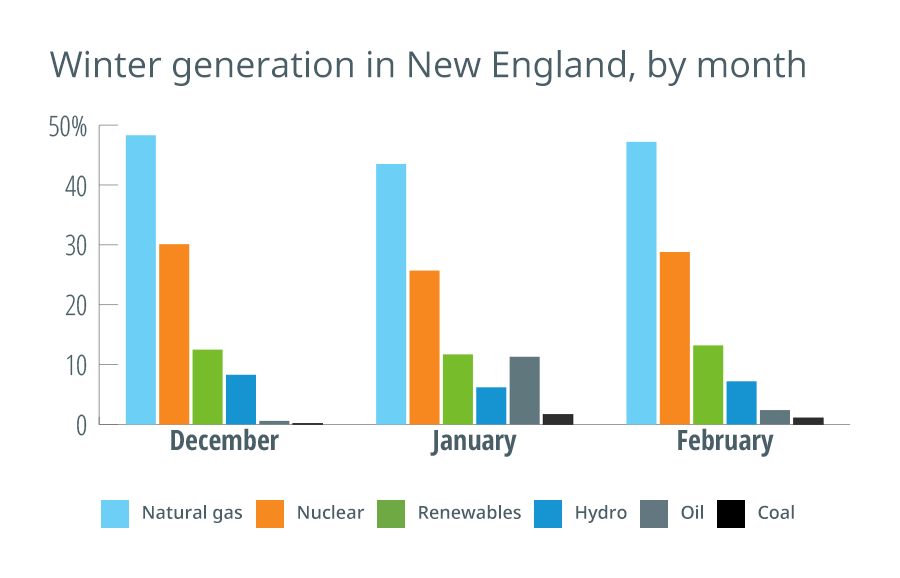
Oil-fired generation accounted for 5% of all the electricity produced within New England this winter, compared to just 0.5% last year. Generation from natural-gas-fired plants fell from about 50% of the region’s fuel mix last winter to about 46% this year, while nuclear generation was roughly flat, producing about 28% of the electricity generated within the region. Production from grid-connected wind and solar resources saw slight increases, accounting for 4.8% and 1.6% of the region’s generation, respectively. Hydroelectric resources accounted for just over 7% of the region’s generation this winter, compared to more than 8.5% last winter.
New England received net imports of about 6,700 GWh of electricity from neighboring regions from December through February.
The season also saw the highest energy market participation by demand-response resources of any month since price-responsive demand was implemented in June 2018. The 13 GWh of demand reduced in real time by these resources in January 2022 was more than double the next highest total, of 5.4 GWh in July 2019.
The mix of resources used to produce the region’s electricity is a key driver of CO2 emissions. The ISO estimates these emissions through an analysis that blends data on electricity generation by fuel type with an emissions factor for each fuel that is based on data from the Environmental Protection Agency.
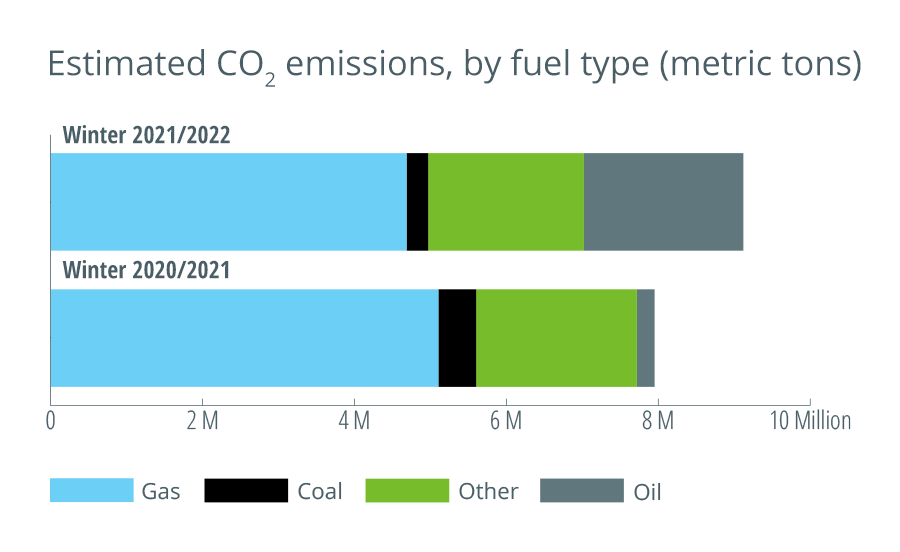
From December through February, CO2 emissions from New England power plants were up about 15% from the previous winter, rising from an estimated 7.94 million metric tons to 9.11 million. The increase was due to this winter’s significantly higher output from oil, which produces more CO2 per megawatt-hour of electricity generated than any other fuel used in the region.
Oil-fired generators produced an estimated 2.1 million metric tons of CO2 this winter, which was roughly nine times last winter’s total. Emissions from natural-gas-fired plants fell about 8%, from 5.1 million metric tons to 4.7 million, while emissions from coal-fired plants fell by more than 40%, from nearly 500,000 metric tons to about 284,000. CO2 emissions from other resources—mostly refuse and wood—also fell slightly, to 2.05 million metric tons this winter.
The ISO recently began including CO2 emissions estimates in its monthly updates on wholesale electricity prices and demand.
Looking ahead
The winter of 2021/2022 is behind us—but the ISO’s engineers, economists, and other experts continue to lay the groundwork to help the region prepare for the winters ahead.
Part of that preparation involves situational awareness, including the ISO’s work to collect data about fuel supplies for the region’s generation fleet. According to ISO estimates, only 48% of the fuel oil used to generate electricity this winter has been replenished—and aggregate fuel oil inventories are close to the lowest levels seen since the ISO started tracking this information. The region’s tanks were estimated at about 36% full at the end of the winter, after entering the season at 53% full. Significant replenishment will be needed in the months ahead to restore inventories to normal pre-winter levels.
Ahead of next winter, the ISO will work closely with transmission and distribution owners to conduct a tabletop exercise to evaluate existing operational processes and communication protocols that would be used during an energy emergency. The exercise is expected to include a simulated emergency leading to multiple days of shortages.
Work is continuously being done to assess the upcoming winter, including an energy analysis. Similar to the analysis conducted for this winter, the outlook for the winter of 2022/2023 will identify potential reliability risks through an examination of anticipated system conditions under various weather scenarios. The ISO also publishes its 21-Day Energy Assessment Forecast and Report weekly from December through March, and bi-weekly from April through November. Designed to improve situational awareness for New England’s market participants, regulators, government officials, and other stakeholders, the report offers a rolling three-week analysis of anticipated power system conditions, taking into consideration variables such as fuel supplies, weather, and electricity demand.
Weather forecasts will continue to be a critical factor for these operational outlooks, as well as in the day-to-day management of the grid. Two projects are underway to improve the ISO’s forecasting capabilities and understanding of how weather will impact the grid:
- A project designed to improve forecast accuracy for the zonal and regional load forecast models will implement a process for blending multiple forecasts for behind-the-meter photovoltaic (BTM PV) generation. The project will also expand the ISO’s regional weather forecasts from eight cities to 23, and incorporate two additional weather concepts. The forecast enhancement project is expected to be complete by July 2023.
- In a collaboration with the Electric Power Research Institute (EPRI)—an independent, non-profit energy research and development organization—the ISO is conducting a probabilistic energy security study to assess energy security risks over the next decade under different extreme weather scenarios. The study is expected to be complete in 2023.
The winter of 2021/2022 was mild, but colder winters will come. As New England continues its journey toward a decarbonized electric grid, concerns about the region’s energy supply chain during periods of extreme cold weather remain. The ISO continues to work with the states and stakeholders to identify solutions for a robust, secure supply chain for electricity that will support the region’s transition to clean energy.
1A British thermal unit (Btu) is used to describe the heat value of fuels, providing a uniform standard for comparing different fuels. One million British thermal units are shown as MMBtu.
- Categories
- Inside ISO New England
- Tags
- system operations, wholesale markets, winter