
Monthly ISO-NE report follows trends in energy resource output
ISO-NE’s System and Market Operations Report is a detailed overview of information about the regional power grid.
Read More- Categories
- Inside ISO New England
- Tags
- resource mix
Add quotation marks to find an exact phrase (e.g., “offshore wind”).
ISO-NE’s System and Market Operations Report is a detailed overview of information about the regional power grid.
Read More
Total production for the year was 1% higher than in 2024.
Read More
One piece of the ISO Express data dashboard shows how the makeup of New England’s energy supply changes throughout the day.
Read More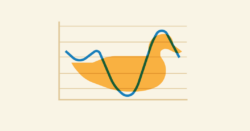
“Duck curve” days are happening with increasing frequency and deepening impact as more behind-the-meter solar comes on line.
Read More
Here’s a breakdown of one of the most prominent features of the iso-ne.com homepage.
Read MoreTotal production for the year amounted to 116,719 gigawatt-hours, 2% higher than in 2023.
Read MoreOutput from solar installations increased by 6% from 2022, rising to 3,851 gigawatt-hours.
Read More
Carbon dioxide emissions in 2021 were 20% lower than a decade ago.
Read MoreAs the region’s resource mix evolves, so too must the methods by which ISO New England measures capacity contributions.
Read More
The reduction was equal to the amount of energy consumed by about 430,000 homes in one year.
Read More