Changing temperatures and a global pandemic: New England’s 2020/2021 winter recap

During the winter of 2020-2021, the power system of New England operated reliably, despite regional impacts of a continuing global pandemic and lower temperatures than last year.
Impacts on winter electricity usage
As COVID-19 continued across the globe, the ongoing remote business and learning postures in New England impacted electricity usage. Notably, our region’s grid saw a higher-than-average evening peak and higher midday loads as compared to previous winters – a reflection of shifting consumer schedules and shifting temperatures.
Between Dec. 21, 2020, and Jan. 20, 2021, the region experienced 31 consecutive days where temperatures were above normal for the season; however, late January and February turned colder. Overall, New England winter temperatures averaged 2.5 degrees cooler than last winter.
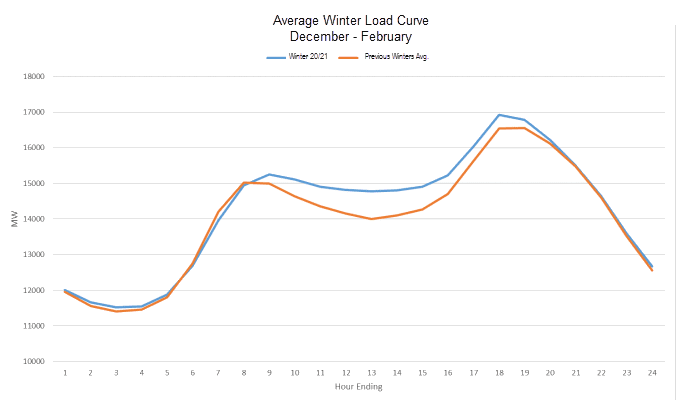
On December 17, 2020, the region’s winter demand peaked at 18,887 megawatts (MW), a decrease of 0.9% from last year’s winter’s peak of 19,065 MW. In total, New Englanders used 30,840 total gigawatt-hours (GWh) of electricity during the winter of 2020/2021, up 0.8% from the previous year.
The all-time peak in winter demand occurred on Jan. 15, 2004, coming in at 22,818 MW.
Increased natural gas prices trigger higher wholesale power costs
When late January and February of 2021 turned colder, demand for natural gas in the region increased, driving wholesale power prices up. New England’s natural gas supplies are prioritized to meet customer heating needs first and generally what remains is available for generating electricity. Higher natural gas commodity prices led to average wholesale power costs of $51.66 per megawatt-hour (MWh), up 72% from last year.
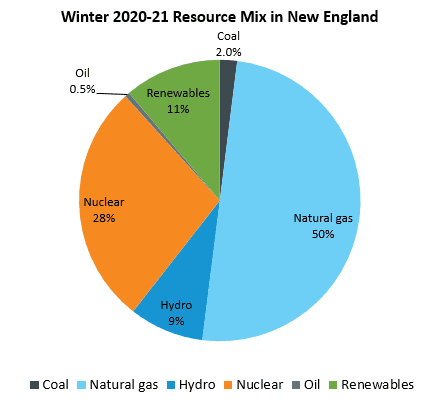
“Natural gas accounted for 50% of New England’s fuel mix this past winter. When temperatures drop, the natural gas available to gas-fired generators is limited,” said Mark Karl, the ISO’s vice president, market development & settlements. “Greater demand means higher wholesale natural gas costs for generators, reflected in higher wholesale electricity prices.”
Natural gas the predominant fuel
Natural gas continued as the major resource for electricity production in the region. Nuclear power plants generated 28%, while renewable and hydro resources generated 11% and 9%, respectively. Coal and oil units accounted for less than 3% of the generation combined.
Comparison: Winter 2019-20 vs. Winter 2020-21
| Winter 2019-20 | Winter 2020-21 | Percent +/- | |
|---|---|---|---|
| Average Wholesale Electricity Price ($/megawatt-hour2) | $29.97 | $51.66 | 72% |
| Average Natural Gas Price ($/MMBtu3) | $3.31 | $5.84 | 76% |
| Peak Demand4 | 19,065 MW | 18,887 MW | -0.9% |
| Total Electricity Use (GWh5) | 30,513 GWh | 30,840 GWh | 0.8% |
| Total Value of Energy Markets | $1 billion | $1.7 billion | 70% |
1 Winter months are December, January, and February.
2 One megawatt (MW) of electricity can serve about 1,000 average homes in New England. A megawatt-hour (MWh) of electricity can serve about 1,000 homes for one hour.
3 A British thermal unit (Btu) is used to describe the heat value of fuels, providing a uniform standard for comparing different fuels. One million British thermal units are shown as MMBtu.
4 One gigawatt-hour (GWh) can serve about one million homes for one hour.
5 Since June 1, 2018, active demand-response resources have been able to participate on an hourly basis in the wholesale electricity markets. These resources reduce demand in real-time.
- Categories
- Industry News & Developments
- Tags
- covid-19, natural gas, resource mix, wholesale markets, wholesale prices, winter