A primer on ISO-NE’s 21-day forecast for New England’s energy supplies

ISO New England launched a new format for the report in December 2022. An updated article details the report’s latest graphics and features.
For the past three years, ISO New England has published the 21-Day Energy Assessment Forecast and Report—a one-of-a-kind energy supply outlook that offers a rolling three-week analysis of anticipated power system conditions, taking into consideration variables such as fuel supplies, weather, and electricity demand.
Designed to improve situational awareness for New England’s market participants, regulators, government officials, and other stakeholders, the report is among many actions the ISO has taken over the past two decades to raise awareness and address concerns about regional energy adequacy.
This article answers questions about the history and content of the forecast, and explains how to read and interpret the charts included in the report.
Why did ISO New England create the forecast?
The ISO developed the forecast in the wake of two weeks of extreme cold weather in December 2017 and January 2018. Cold weather drives heating demand for natural gas to levels that approach the capacity of the pipelines. Once the demand for heating and power generation exceed pipeline supply capacity, generators typically need to use alternate fuel or liquefied natural gas (LNG). During the 2017/2018 cold snap, the reliability of New England’s power system relied on generators fueled by oil stored in onsite tanks—but oil supplies ran low as the cold weather wore on, and some power plants were at risk of running out of fuel. In addition, gas-fired generators were reliant on stored LNG, which was also in short supply.
The goal of the forecast is to provide early warning of potential energy shortfalls if the region’s power system is expected to run low on oil or other fuels, such as LNG, during periods when the region’s natural gas pipelines may be constrained. With up to three weeks’ notice, the report gives resource owners time to evaluate the status of their resource’s fuel supplies and to arrange for replenishment, as needed, or to reschedule maintenance in order to maximize availability.
In conjunction with the development of the report, the ISO made revisions to Operating Procedure 21 — Energy Inventory Accounting and Actions During An Energy Emergency (OP-21), including an expanded survey of all New England generating facilities. The survey enhances ISO’s situational awareness of regional fuel supplies, replenishment strategies, and potential emissions limitations.
Where can I find the forecast?
Current and past forecast reports are available on ISO New England’s website on ISO Express.
How often is the forecast updated?
The ISO updates the forecast year-round, publishing the report weekly from December through March, and once every two weeks from April through November. In situations where more frequent updates are necessary, for example during an Energy Alert or Energy Emergency, the ISO will update the report more frequently.
Why does the forecast period cover three weeks?
Fuel supply chain logistics are the primary factor. In a typical winter, if fuel is readily available for delivery to New England, the forecast’s three-week timeframe allows generators to schedule deliveries. This year could prove more complicated, as higher than normal global fuel prices, a shortage of truck drivers, and other supply chain issues are converging to potentially create longer lead times.
In addition, weather forecasts, which are a key factor in the ISO’s forecasts for electricity demand and pipeline gas availability, are most accurate within a three-week window.
How is the forecast created?
Two key building blocks of the 21-day energy assessment forecast are weather data and electricity demand forecasts. The energy assessment combines these variables with planned outages of generators and transmission facilities, as well as information from the OP-21 generator survey. Based on this information, the energy assessment provides an estimate of whether the supply of electricity during each hour of the three-week period will be enough to cover forecasted demand and operating reserve requirements.
What do the alert thresholds mean?
The energy assessment compares the hourly forecast results against established thresholds to trigger the declaration of Energy Alerts and Energy Emergencies. Any declarations are listed on the first page of the report, along with information about when each alert or emergency was declared and a projection of when it will end.
- An Energy Alert warns of a forecasted energy shortfall in days six to twenty-one of the assessment.
- An Energy Emergency warns of a forecasted energy shortfall in days one to five of the assessment.
The first page also includes a “Status Summary,” where the ISO will include information about expected system operating conditions during the forecast period.
What do the charts show?
The report includes a series of charts designed to illustrate expected system conditions over the next three weeks. They include:
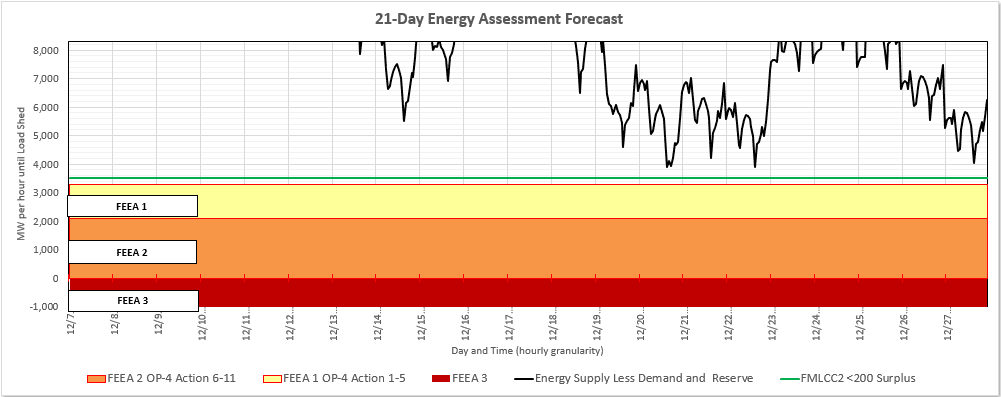
21-Day and 5-Day Energy Assessment Forecast
Line charts on pages 2 and 3 show exactly when system conditions would warrant an Energy Alert or Energy Emergency.
A black line tracks the anticipated hourly energy surplus or energy deficit during the forecast period of five or twenty-one days. The line is not visible on the chart unless the forecasted energy surplus falls below 5,000 MW in one or more hours.
The chart includes several regions shaded in different colors, which show the energy supply thresholds that trigger an alert or emergency:
- The green line represents the threshold for Master/Local Control Center Procedure No. 2 (M/LCC2), meaning a surplus of less than 200 MW is forecast. No alert is issued for this threshold.
- The yellow region represents Forecast Energy Emergency Alert Level 1 (FEEA1), meaning the ISO expects to implement Actions 1-5 of Operating Procedure 4 (OP-4), Action During a Capacity Deficiency. No alert is issued for this threshold.
- The orange region represents Forecast Energy Emergency Alert Level 2 (FEEA2), meaning the ISO expects to implement Actions 6-11 of OP-4. An Energy Alert is issued if the shortfall exceeds this threshold in one or more consecutive hours during days six to twenty-one of the forecast; an Energy Emergency is declared if this threshold is exceeded in one or more consecutive hours during days one to five of the forecast.
- If the black line dips into the red region—Forecast Energy Emergency Alert Level 3 (FEEA3) —it means there is a forecasted energy deficit and the need for controlled power outages is anticipated. In such conditions, the ISO expects to take emergency actions under Operating Procedure 7 (OP-7), Action In An Emergency, including controlled power outages, to protect the stability of the region’s power system. An Energy Emergency is declared if controlled outages are forecasted in one or more hours during days one to five of the forecast, or if they have already begun.
In the sample chart below, the forecasted energy surplus remains above the thresholds for an Energy Alert or Energy Emergency.
Forecast Temperature and Load
When it gets cold, potential power system issues aren’t necessarily due to high demand for electricity—they may also be due to insufficient fuel supplies.
The chart on page 4 shows the expected hourly temperatures and demand for electricity during the report’s three-week window. In periods of cold weather, natural gas pipeline constraints can occur when there is simultaneous demand for natural gas from both heating customers and electric power generators. This, in turn, can lead to the dispatch of resources not fueled by natural gas and, as a result, a depletion of other stored fuels in the region.
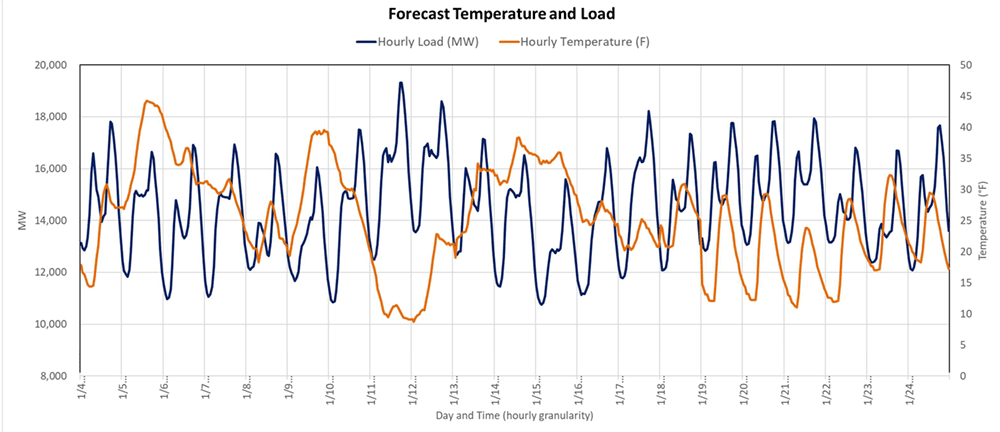
According to the ISO’s recently released winter outlook, the region’s demand for electricity this winter is expected to peak at 19,710 MW during average weather conditions of 10°F, and 20,349 MW if temperatures reach below average conditions of 5°F. New England’s all-time winter peak record was set during a January 2004 cold snap, when electricity use reached 22,818 MW.
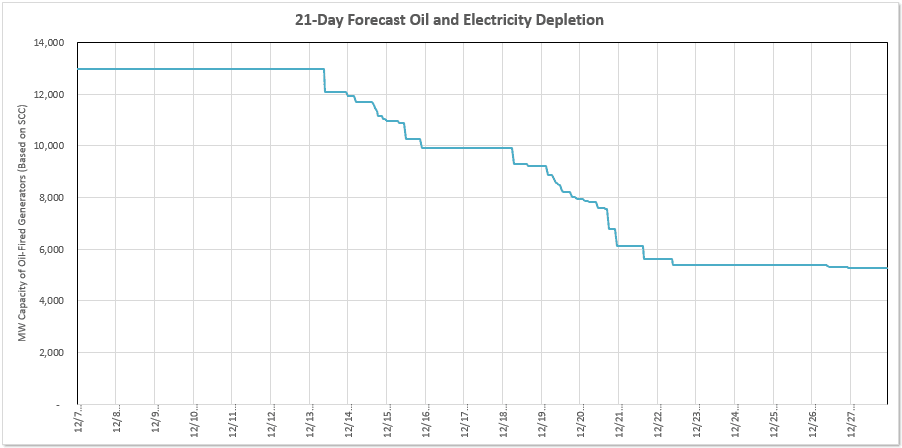
21-Day Forecast Oil and Electricity Depletion
Without replenishment, oil-fired generators would eventually run out of fuel. If they do, they go out of service until new deliveries arrive.
The chart on page 5, which is based on the expected dispatch of each resource in the 21-day energy assessment, tracks the availability of electricity from oil-fired generators, including those that are dual-fuel resources. As depicted in the sample chart below, as oil-fired generators utilize their available oil, their seasonal claimed capability is subtracted from the line’s starting point—the total available seasonal claimed capability of the region’s fleet—and the line begins to drop. The chart quantifies the amount of oil-fired capacity that could potentially become unavailable due to a lack of oil, and offers a signal for resources to make arrangements for oil deliveries.
Where can I learn more?
- ISO New England Operating Procedure 21 – Operational Surveys, Energy Forecasting & Reporting and Actions During An Energy Emergency
- Timeline: Historical Efforts to Address Fuel Security Issues in New England
- Follow ISO New England on Twitter: @isonewengland
- Find updates at isonewswire.com.
- Download the ISO to Go app.
- Follow real-time data on New England’s wholesale electricity markets and power system operations at ISO Express.
- Categories
- Features & Interviews
- Tags
- system operations, weather, winter