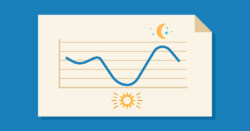
System Load Graph tracks ebb and flow of daily electricity use
Here’s a breakdown of a key part of the ISO Express data dashboard.
Read More- Categories
- Inside ISO New England
- Tags
- system demand, website
Add quotation marks to find an exact phrase (e.g., “offshore wind”).
Here’s a breakdown of a key part of the ISO Express data dashboard.
Read More
Regional solar production dropped by an estimated 4,000 MW during the event.
Read More
Grid demand on April 9, 2023 was 750 MW lower than the previous record, set last May.
Read More
The ISO declared a capacity deficiency, meaning the region’s supply of electricity was insufficient to meet required operating reserves in addition to satisfying consumer demand.
Read More
Peak demand for electricity from the grid topped 23,000 MW on four days from July 19-24, but remained slightly below ISO New England’s forecast for average summer weather.
Read More
Behind-the-meter solar produced more than 4,000 megawatts of estimated electricity during the afternoon hours.
Read More