New England’s power grid operates reliably during six-day July heat wave

New England’s power grid operated reliably during the first heat wave of 2022, which saw six straight days of above-average temperatures.
Peak demand for grid electricity topped 23,000 megawatts (MW) on four days from July 19-24, but remained slightly below ISO New England’s forecast for average summer weather.
“While this was not a heat wave of historic proportions, it was not without challenges, including unplanned generator outages and reductions,” said Vamsi Chadalavada, ISO New England’s executive vice president and chief operating officer. “Our Operations staff managed the grid through teamwork, precise forecasting, and rigorous planning, helping to ensure New Englanders had the electricity they rely on for their comfort, health, and safety. We also thank the region’s generation and transmission owners for their work to keep the power flowing.”
Weather, demand, and prices
The heat wave was the region’s longest in several years. But while temperatures hovered between 7˚ and 9˚ Fahrenheit (F) above normal, dew points—a measure of humidity—were not extreme, and the heat index remained below 100˚F. Boston’s weeklong high temperatures were the 11th-highest ever recorded, while Hartford’s ranked 20th. The highest weighted-average temperature of eight New England cities, 94°F, occurred on Sunday, July 24.
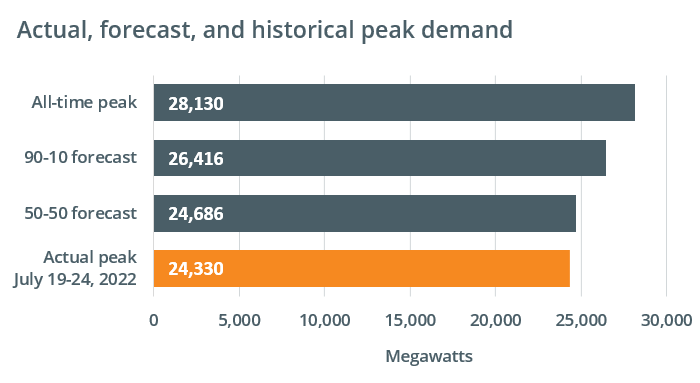
Hot and humid weather drives up electricity demand as residents and businesses power up air conditioning to keep cool. The highest hourly demand for electricity, 24,330 MW, occurred between 6 and 7 p.m. on Wednesday, July 20. The ISO’s summer outlook predicted a peak of 24,686 megawatts (MW) during typical weather (known as the 50-50 forecast1), with high heat and humidity pushing demand to 26,416 MW (the 90-10 forecast).
New England’s all-time peak demand was 28,130 MW, recorded during an August 2006 heat wave. While the peak during the most recent heat wave does not make the list of the region’s top 10 demand days, the July 24 peak of 23,711 MW ranks sixth among weekend days.
Wholesale electricity prices reflect both demand for electricity and the cost of fuels used in generation—so higher electricity prices typically accompany the elevated demand associated with hot weather.
System locational marginal prices (LMPs) averaged roughly $171 per megawatt hour (MWh) during the heat wave, and system energy and reserve pricing properly reflected the tight system conditions on several days.
Operations
Beginning on July 18 and continuing through the week, ISO Operations staff held conference calls and meetings with managers at the region’s local control centers and the Northeast Power Coordinating Council.
Due to the forecast system conditions and expectations for reduced capacity, ISO New England declared a Master/Local Control Center Procedure No. 2 (M/LCC 2) event at 4 p.m. on July 19. The status, which indicates abnormal system conditions, remained in place until 10 p.m. on July 24. The notification alerts applicable power system operations, maintenance, construction, and test personnel, as well as market participants, that they should suspend testing or maintenance on their resources that could affect reliability.
Some unplanned resource outages and reductions occurred during the heat wave, averaging about 1,500 MW each day. On July 20—the day system demand peaked—unplanned outages and reductions totaled about 3,500 MW. The majority of the outages were due to mechanical issues; some resources saw reduced output due to high ambient temperatures.
Supplemental resource commitments, which meet demand and operating reserve requirements when there are unplanned outages and reductions, or when insufficient supplies clear in the day-ahead market, averaged about 850 MW every day except for Saturday, July 23.
Fuel mix and emissions
Natural gas, oil, and hydropower resources ramped up to provide energy during times of peak demand throughout the heat wave.
Behind-the-meter solar (BTM PV), meanwhile, tempered mid-day demand for grid electricity throughout the heat wave. On July 19, BTM PV generation reduced system demand by roughly 4,000 MW. Without contributions from BTM PV, system demand would have approached levels forecast for weather much hotter and more humid than average.
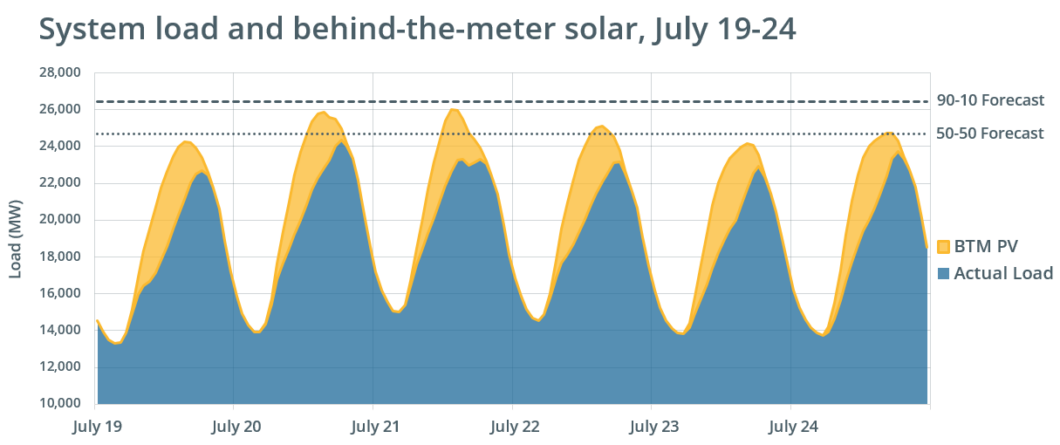
Solar production peaks in the early afternoon, several hours earlier than system demand. This means other resources must ramp up as solar production wanes in the late afternoon and early evening, to supply the electricity needed to meet the system peak.
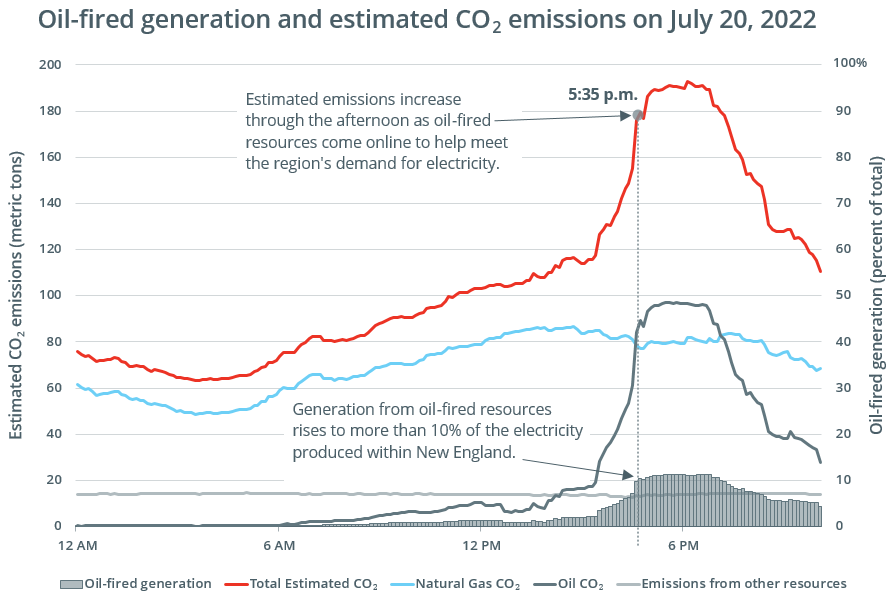
Fuel inventory surveys the ISO conducted indicate that generators consumed about 6 million gallons of oil (about 143,000 barrels) from July 12-25. The majority of that consumption occurred during the heat wave, when oil-fired generation accounted for more than 11% of the electricity produced within New England during some afternoon and evening hours.
Coupled with the overall increase in demand for electricity, this type of shift in the resource mix drives up regional air emissions, as oil-fired resources produce more CO2 per megawatt-hour of electricity generated than any other fuel. The ISO estimates these emissions through an analysis that blends data on electricity generation by fuel type with an emissions factor for each fuel that is based on data from the Environmental Protection Agency.
At an estimated 845,967 metric tons, CO2 emissions from New England power plants during the heat wave were about 50% higher than the same week last year, and nearly 17% higher than a six-day period in late June and early July 2021 that included a three-day heat wave and record-setting temperatures.
The ISO also publishes emissions estimates on ISO Express, a dashboard of real-time power system data. In the chart below, data drawn from ISO Express illustrates the relationship between oil-fired generation and estimated CO2 emissions on July 20, when demand during the heat wave was at its highest.
1The 50-50 forecast is for electricity demand during average weather, and means that there is a 50 percent chance peak demand will be above or below the forecast. The 90-10 forecast—which reflects above average heat and humidity in the summer, and colder than average temperatures in the winter—means there is a 10 percent chance that peak demand will be higher than the forecast.
- Categories
- Inside ISO New England
- Tags
- peak demand, summer, system demand, system operations, weather