Power system operates smoothly during the June 28-30 heat wave
As June concluded, temperatures surged throughout New England, causing high demand for air conditioning and the electricity that powers it. In Boston, temperatures soared to 100 degrees on June 30, the highest temperature the city had seen in June in nearly 70 years.
With a peak of above 24,500 megawatts (MW) across the three days, ISO New England’s system operators were able to rely on a high-performing fleet of resources to keep the grid running smoothly and reliably throughout the heat wave.
Daily peaks during heat wave
The highest hourly average demand for electricity during the heat wave occurred around 6 p.m. on Tuesday, June 29, at 25,159 MW. This is comparable to recent summer peak loads in New England, at 24,736 MW in 2020; 24,004 MW in 2019; and 25,808 MW in 2018.
The current peak doesn’t quite make the ISO’s Top 10 Demand Days but it came close. Summer peaks on the hottest and most humid days have averaged roughly 25,600 MW since 2000. The region’s highest-ever peak in demand, at 28,130 MW, occurred during the hour from 2 to 3 p.m. on Wednesday, August 2, 2006, during a heat wave.
Real-Time Energy Market prices hit a high of $226.72/megawatt-hour Monday, June 28, during the hour from 5 to 6 p.m.
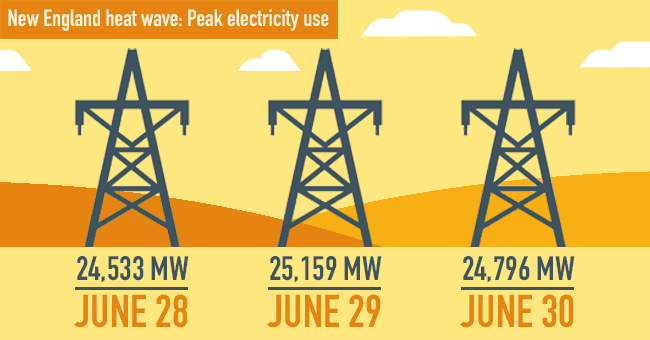
Table 1. Peak load from June 28 – 30
| Peak Load (Day & Time) | Electricity Use (MW) |
| Monday June 28, 2021 | 24,533 |
| Tuesday June 29, 2021 | 25,159 |
| Wednesday June 30, 2021 | 24,796 |
COVID-19 Impact
Since March of 2020, ISO New England has published a weekly report that shows the apparent impact of COVID-19 on system load and total energy. These reports analyze models that were created pre-COVID and compare them to the recent energy demands. It provides a better understanding of the energy demand during the pandemic. With a split remote and in-person workforce as businesses in the New England area start opening back up, the demand for energy has been higher on days when more heating or air conditioning is in use (cold and hot days). Read the weekly reports here.
Weather wavered
Boston experienced a record breaking temperature of 100°F on June 30. The last time recorded temperatures were that high during the month of June was in 1952. Hartford, Conn. also experienced record breaking temperatures during the heat wave—and coupled with the intense humidity it felt even hotter. The high temperature reached 99°F on Tuesday, June 29. In Hartford, the last time it was that hot was in 1934, with the previous record standing at 98°F. Additionally, Providence, R.I. had its second-hottest June on record, behind June 1943.
See Table 2 for weather stats for the period of June 28–June 30 in the eight primary cities that ISO New England monitors for its regional weather forecast.
Table 2. Major 8 New England city weather stats for June 28 – June 30
| City | Duration of 90°F or higher (Days) | Highest Reading |
| Boston, Mass. | 3 consecutive | 100°F on June 30 |
| Hartford, Conn. | 3 consecutive | 99°F on June 29 |
| Providence, R.I. | 3 consecutive | 97°F on June 29 |
| Concord, N.H. | 3 consecutive | 97°F on June 28 |
| Portland, Maine | 3 consecutive | 97°F on June 28 |
| Bridgeport, Conn. | 3 consecutive | 96°F on June 30 |
| Worcester, Mass. | 3 consecutive | 93°F on June 29 and 30 |
| Burlington, Vt. | 2 consecutive | 93°F on June 28 and 29 |
Notably, however, Burlington, Vt. experienced their heat wave a day earlier than the rest of the New England cities. Their three consecutive days of 90°F or higher was June 27-29.
Luckily, the heat wave broke in time for a cooler 4th of July weekend.
Solar surged
Behind-the-meter solar generation peaked each day at around 1 p.m. during the heat wave, providing approximately 2,500 MW to homes and businesses around New England. Tuesday, June 29, saw the highest solar generation peak from noon to 1pm, averaging 2,773 MW for that hour.
The vast majority of New England’s photovoltaic (PV) arrays are located at customers’ sites, “behind the meter” on the distribution system. ISO New England can’t “see” what’s happening on the distribution system—which arrays are generating, which are not, and how much—but the impact of all those behind-the-meter PV systems is seen in demand levels. Because those homes and businesses were getting their electricity demand met by their own PV systems, their demand for power from the regional power system was lower by about 2,500 MW at the solar peak during the heat wave.
Before so many PV arrays were installed in New England, summer peak demand typically occurred around 2 or 3 p.m. As more and more PV is meeting mid-afternoon demand for power, the peak in regional demand for power is occurring later in the day, as the sun goes down.
Those interested in seeing real-time estimated production from these solar systems can do so through a new feature on ISO Express.
Forecasting fervor
ISO operators have been gearing up for any strenuous grid conditions this summer could hold far before the season began. Part of the preparation for this particular heat wave depended on careful attention to load and weather forecasts.
Keeping tabs on weather is a vital aspect of preparing for a heat wave’s impact on the grid. Staff meteorologists study the forecasts provided by three weather vendors, apply their own knowledge and experience, and produces an ISO New England forecast. Before and during the heat wave, they closely monitored dew points, as high humidity causes people to blast their air conditioning, placing greater pressure on the grid. See our 2021 summer outlook.
- Categories
- Inside ISO New England
- Tags
- forecast, peak demand, solar, summer