Let the sunshine in: View regional energy usage—including behind-the-meter solar—through ISO Express

As New Englanders increasingly turn to the power of the sun for their individual home and business electricity needs, the demand for energy from the region’s power grid is changing. A window into just how much, is available through a new option in the Real-Time Maps and Charts on ISO Express.
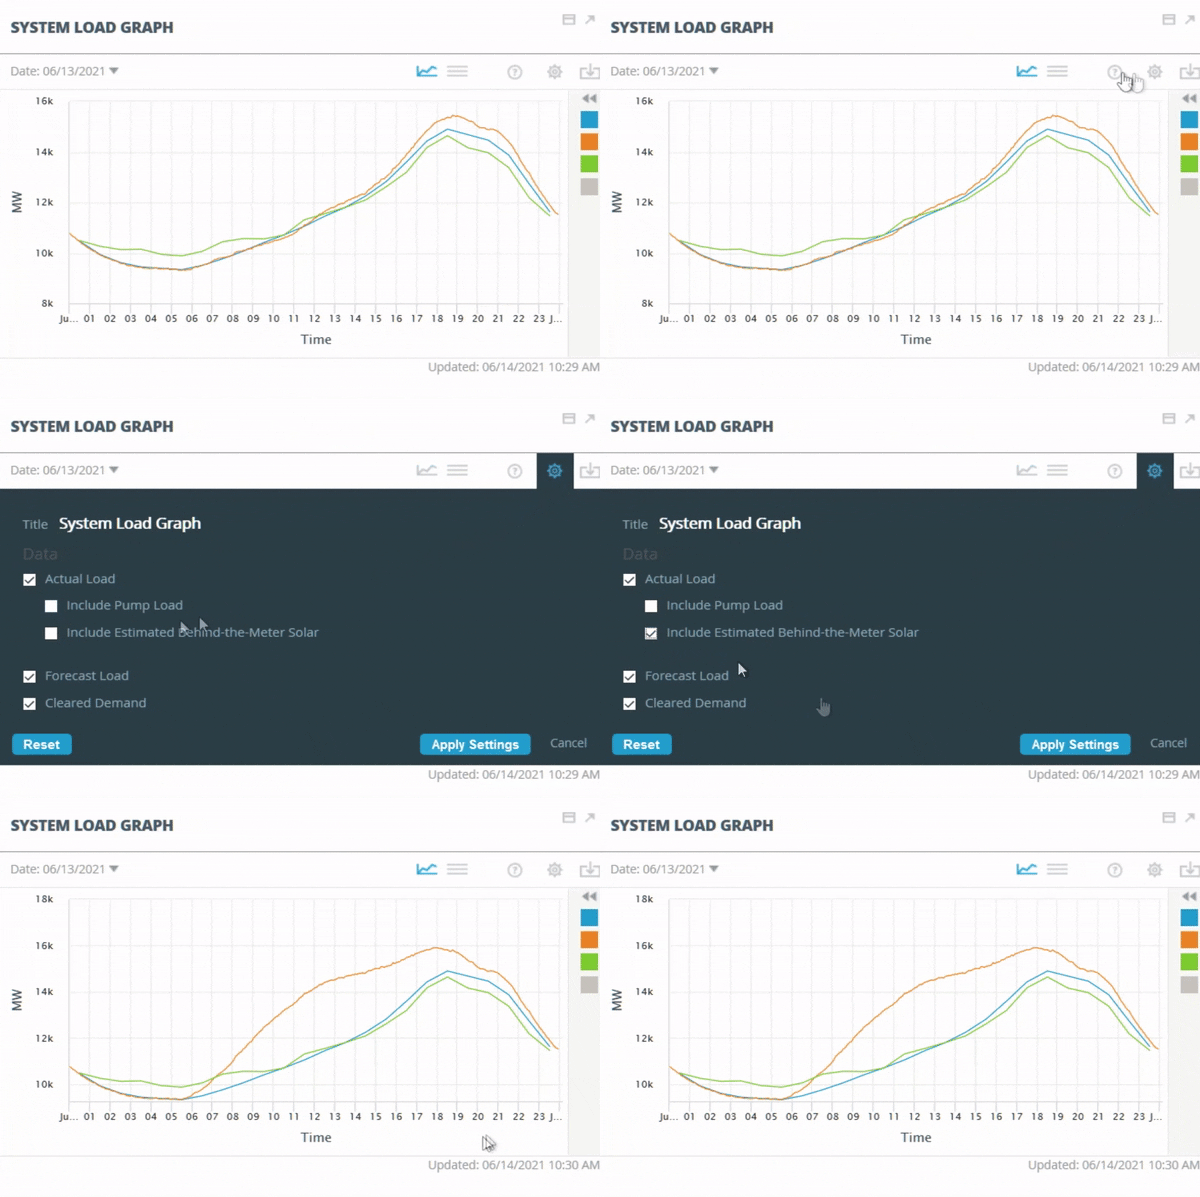
By selecting “Include Estimated Behind-the-meter solar,” in the System Load Graph settings, the chart’s data line is updated to reveal an estimate of the region’s total electricity usage from both grid resources and the more than 200,000 solar installations capable of producing over 4,000 megawatts for New England homes and businesses, or what are called ‘behind-the-meter’ resources.

When the new feature is enabled, the graph shows a combination of actual real-time grid demand coupled with estimated production from these behind-the-meter resources. Learn more about how the ISO forecasts behind-the-meter solar.
“The data tells a powerful story,” said Mike Knowland, ISO New England’s manager of Forecast and Scheduling. “On bright sunny days with comfortable weather, we see behind-the-meter solar decrease the amount of power needed from the grid by quite a bit, sometimes as much as 28 percent.”
That’s good news for solar power users, although Knowland cautions, “Unexpected changes in weather—particularly cloud cover—can quickly drive up the need for grid resources. The demand for electricity is still there, it’s just being met by distributed resources that are behind the meter. If the solar supply changes, we respond with other resources. And now you can see the estimated amount, right there on the website.”
- Categories
- Inside ISO New England
- Tags
- distributed energy resources, renewable resources, resource mix, solar
