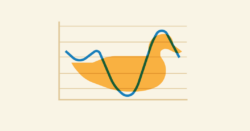
New England grid saw 134 ‘duck curve’ days in 2025
On sunny days, behind-the-meter solar supplies a significant amount of electricity that otherwise would come from the grid.
Read More- Categories
- Inside ISO New England
- Tags
- solar
Add quotation marks to find an exact phrase (e.g., “offshore wind”).
On sunny days, behind-the-meter solar supplies a significant amount of electricity that otherwise would come from the grid.
Read More
Duck curves occur when demand is lower at midday than overnight. Last year’s 100th duck curve happened in late November. This year’s was in mid-September.
Read More
Contributions from behind-all-meters solar were equivalent to the power consumed by 600,000 homes in a year.
Read More
“Duck curve” days are happening with increasing frequency and deepening impact as more behind-the-meter solar comes on line.
Read More
New tools give system planners greater insight into solar power and battery systems that reduce demand for grid electricity.
Read More
It was the fourth year in a row the region notched such a milestone.
Read More
Duck curve days are becoming more frequent as more New England homeowners and businesses install solar power systems.
Read More
The ISO’s annual report shows emissions have dropped considerably over the last decade.
Read More
The ISO’s categories for solar photovoltaic resources focus on how they interact with our control room and the wholesale markets.
Read More
ISO-NE's Mike Knowland explains why it's becoming more common to see lower demand for grid electricity during the day than at night.
Read More