Reserve price graph shows data during rare power grid conditions
This is the latest installment in a series highlighting data visualizations created by ISO New England to help explain different aspects of the region’s bulk electric system.
Part of keeping the power grid reliable is ensuring there are sufficient backups in case of major equipment failures. The Real-Time Reserve Prices Graph, part of the ISO Express dashboard, shows when and how resources are compensated for providing that backup.
Compared to the other charts on ISO Express, this one is relatively inactive. Real-time reserve prices were zero more than 90% of the time in 2024, for instance.
The prices climb only during rare times when it becomes necessary for one or more of the region’s energy resources to reduce or stop electricity production in order to satisfy reserve requirements instead. Reserve prices make up for what these resources would have earned by selling electricity, ensuring that switching to provide reserves leaves them no worse off.
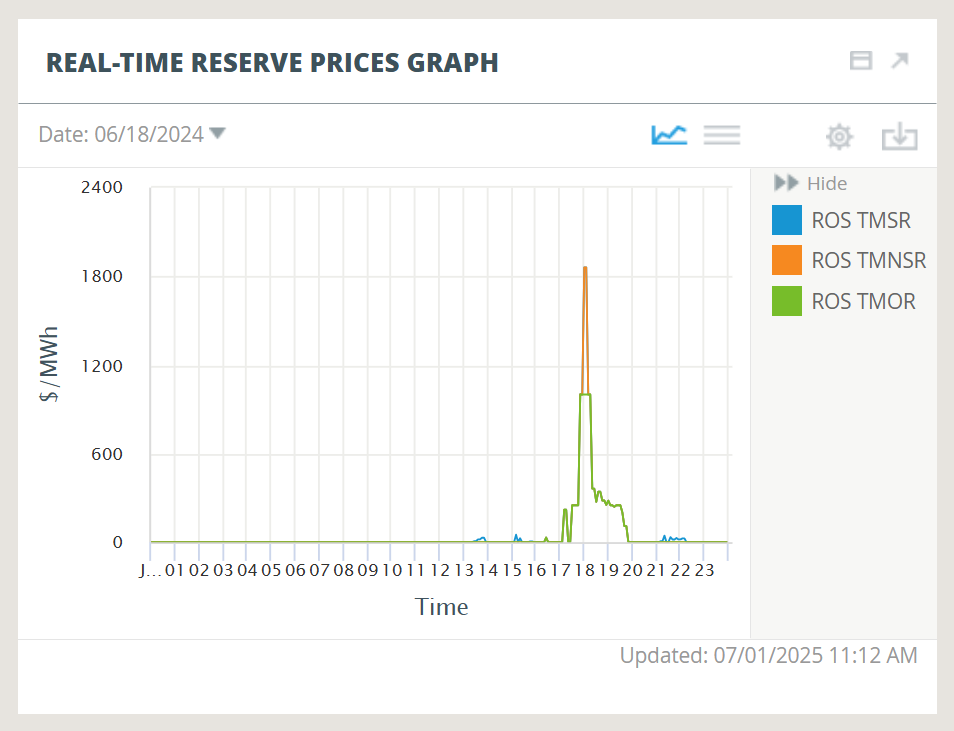
The Real-Time Reserve Prices Graph reflects the three types of reserve products that resources may offer depending on their start-up time and ramping capabilities.
- The blue line represents 10-minute spinning reserve (TMSR) prices. “Spinning” indicates resources that are already on line and available to increase their output.
- The orange line represents 10-minute non-spinning reserve (TMNSR) prices. Non-spinning resources are off line, but able to start up quickly to inject electricity into the system.
- The green line represents 30-minute operating reserve (TMOR) prices. These prices apply to spinning resources capable of increasing output, or non-spinning resources capable of coming on line, within half an hour.
The example above is taken from June 18, 2024, in the middle of a heat wave. Reserve prices were zero in the morning, but began to rise in the afternoon as system conditions prompted ISO-NE system operators to redispatch the system to maintain reserves. Later in the evening, due to higher-than-forecast temperatures and unexpected resource outages, the system fell short of reserve requirements for 25 minutes. The result was a spike in reserve prices (as well as real-time energy prices).
New England has four reserve zones: Greater Connecticut (CT), Greater Southwest Connecticut (SWCT), Northeast Massachusetts and the Boston area (NEMABSTN), and the rest of the system (ROS). By default the Real-Time Reserve Prices Graph displays ROS prices, but users may choose to display prices in each zone by clicking the gear icon. Users may also choose to view data at hourly rather than five-minute intervals.
Section 6 of An Overview of New England’s Wholesale Electricity Markets: A Market Primer provides more detailed information on the Real-Time Reserve Market.
- Categories
- Inside ISO New England
- Tags
- wholesale prices