Resource Mix charts show sources of grid’s electricity
This is the second installment in a series highlighting data visualizations created by ISO New England to help explain different aspects of the region’s bulk electric system.
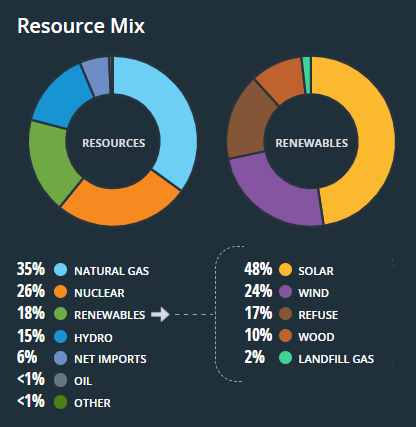
A pair of doughnut charts on the iso-ne.com homepage display in real time the sources of the electricity on New England’s power grid.
The doughnut on the left, labeled “Resources,” breaks down the major categories of resources being used to meet consumer demand in the region, including generation, imports, and energy storage.
Natural gas resources, which produced 51% of the electricity the region consumed in 2024, typically make up the largest segment of the chart. Nuclear and hydro generation are fairly consistent throughout the year, and nuclear usually represents the largest share of generation after natural gas. In contrast, oil and coal resources operate infrequently and often do not appear on the chart.
Net imports reflect the difference between electricity flowing into and out of the New England power grid from the power systems in New York and Canada. New England is a net importer of electricity, and so this number is usually positive. The import category does not appear on the chart during the more uncommon times when the region exports more electricity than it imports.
The “Other” category reflects the output of energy storage devices (excluding pumped hydro) and demand reductions from active demand response resources.
The “Renewables” segment of the chart aggregates a number of renewable resources as classified by the six New England states. The states do not universally consider hydro renewable, and so it is not included in this category.
The “Renewables” doughnut chart on the right further breaks down these renewable resource types, which include refuse, wood, and landfill gas in addition to wind and solar. Output from renewables can vary widely from day to day and even minute to minute. The primary reason is variability in wind and solar power. (This chart does not include output from “behind-the-meter” solar installations that are not connected to the grid.)
More detailed versions of the Resource Mix charts are available on ISO Express and the ISO to Go mobile app.
- Categories
- Inside ISO New England
- Tags
- resource mix