Price Map shows wholesale energy markets in action
This is the first installment in a series highlighting data visualizations created by ISO New England to help explain different aspects of the region’s bulk electric system.
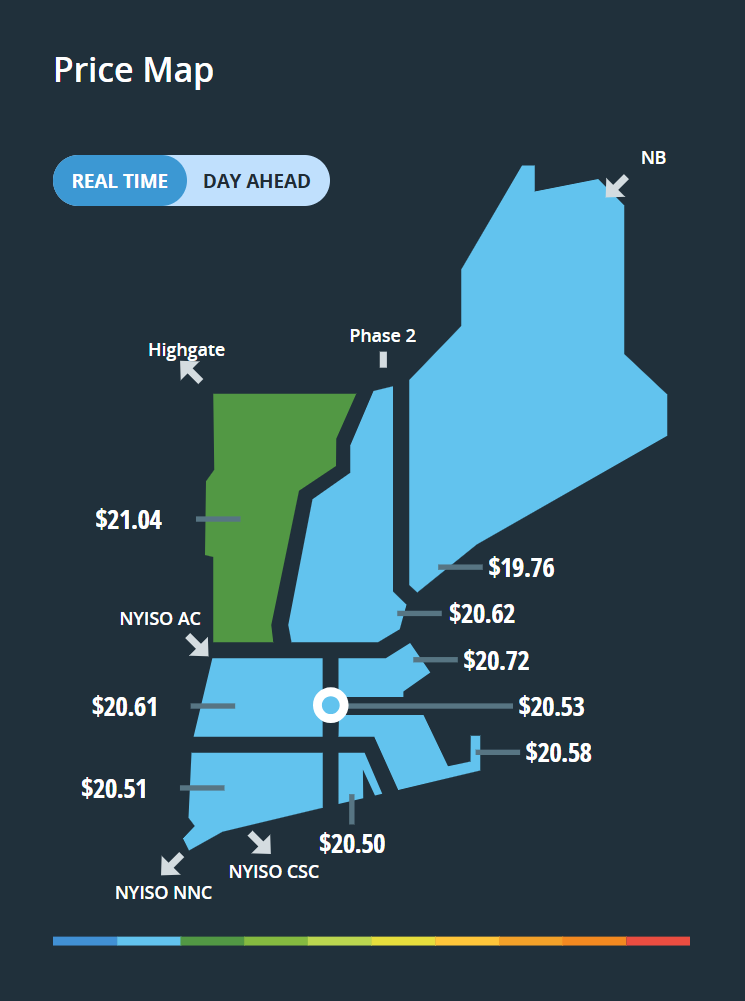
The stylized map of New England on the iso-ne.com homepage is a window into two of the region’s wholesale electricity markets.
The Price Map is divided into eight parts, known as load zones. Connecticut, New Hampshire, Maine, Rhode Island, and Vermont each have one load zone. Massachusetts has three load zones. That’s because densely populated northeastern Massachusetts has different electricity needs than the state’s southeastern and central/western regions.
Each load zone is labeled with a locational marginal price (LMP), which updates every five minutes. Users can toggle between zonal LMPs in the Real-Time Energy Market and the Day-Ahead Energy Market.
Zonal LMPs reflect the average cost of wholesale electricity at hundreds of pricing nodes (also known as pnodes). Prices vary from pnode to pnode and from zone to zone due to local attributes of the transmission system that influence how efficiently electricity can move around.
In addition to the eight load zones, the map also includes a ninth LMP for the Hub. While it’s represented by a white circle in the center of Massachusetts, the Hub isn’t a physical place. Instead, it’s a collection of nodes intended to represent the price of energy separate from any transmission constraints. The Hub LMP is the most commonly referenced price for the New England bulk power system.
Depending on their LMPs, different load zones may appear in different colors at the same time. Most of the time, all parts of the map are blue or green, reflecting relatively low LMPs. Prices tend to increase at times of peak electricity use, or when generation or transmission equipment goes off line unexpectedly. Portions of the map may turn yellow, orange, or red accordingly.
Six arrows represent imports and exports over tie lines connecting New England’s power grid to the grids in New York and Canada. New England is typically a net importer of energy, so the arrows usually point inward. When a tie line is not being used, no arrowhead is displayed.
Versions of the Price Map also appear on ISO Express and on the ISO to Go mobile app.
- Categories
- Inside ISO New England
- Tags
- wholesale prices