ISO-NE rolls out updates to ISO Express dashboard, including behind-the-meter solar change

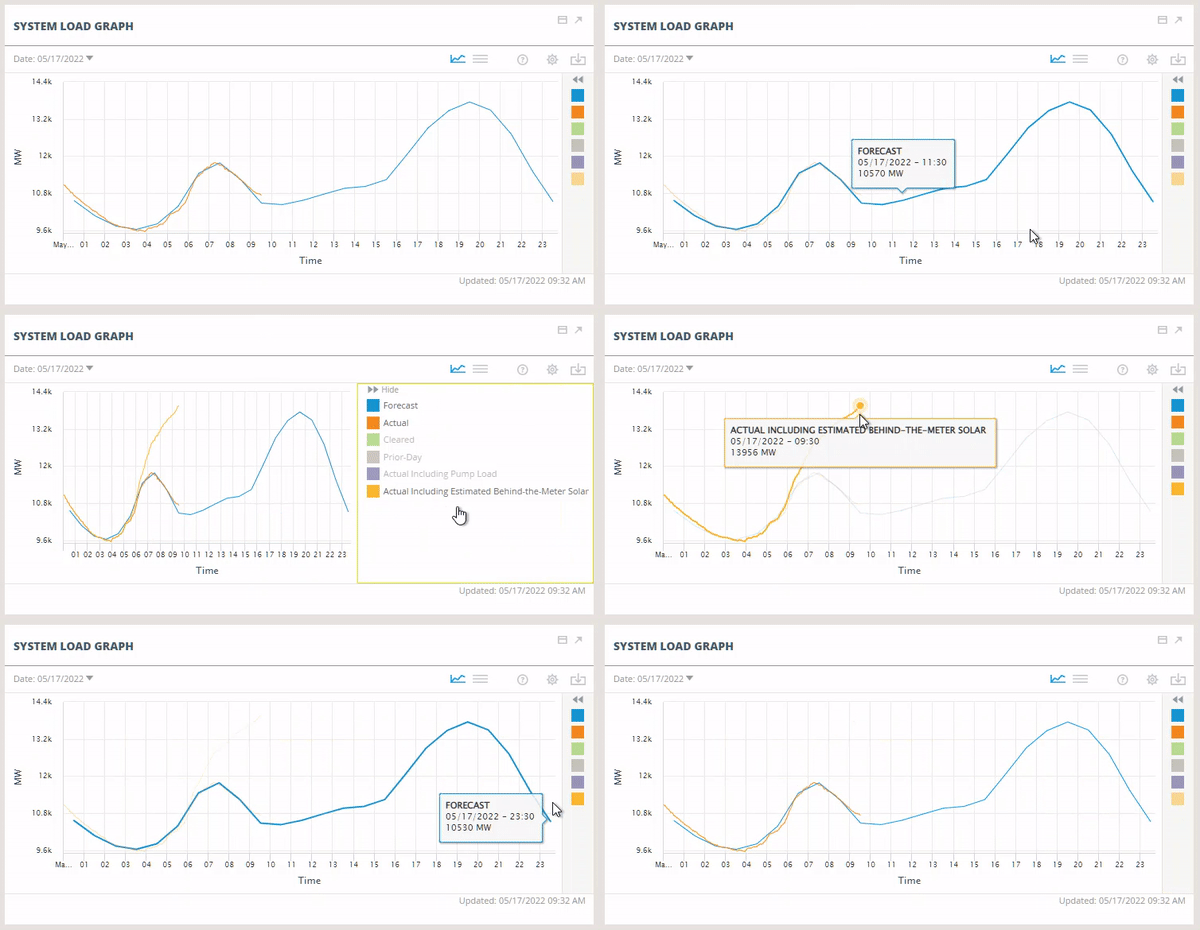
ISO New England has rolled out a number of updates to the ISO Express data dashboard, including one making it easier to see the impact of behind-the-meter solar on regional electricity use.
Users can now simultaneously see actual grid demand and grid demand plus estimated production from behind-the-meter solar photovoltaic resources (BTM PV). Previously, these data points were not visible at the same time.

The actual grid use line will automatically appear when users navigate to ISO Express, while those interested can view grid use combined with estimated BTM PV by toggling on “Actual Including Estimated Behind-the-Meter Solar” in the panel on the right of graph.
The vast majority of solar resources in New England, including residential rooftop arrays, are connected to local distribution utilities or provide power directly to homes and businesses—and not to the regional power system. BTM PV, instead, reduces the amount of electricity drawn from the grid. The ISO doesn’t dispatch the power these resources produce, but has to manage their impact as a reduction in demand.
To ensure reliable operations, the ISO estimates behind-the-meter solar production, using software that turns a weather vendor’s forecast of irradiance—the strength of the sun’s rays—for each city and town in New England into expected production, in megawatts, from the region’s more than 240,000 BTM PV systems. System forecasters then use these estimates in putting together their forecast of regional grid demand.
Other ISO Express updates include:
- Electricity demand from the region’s pumped hydro units is now visible in a similar format to behind-the-meter solar.
- The default view now shows all available reserve prices.
- The default view now shows real-time import and export levels across all interfaces.
- Categories
- Inside ISO New England
- Tags
- clean energy, hydro, imports, renewable resources, solar
