


500 ‘duck curves’ and counting: Growth of solar power brings another New England electricity milestone
The continuing growth of solar power brought New England to a new electricity milestone today: 500 “duck curve” days.
A duck curve happens anytime electricity demand is lower at midday than overnight. This can happen on sunny days when behind-the-meter photovoltaics (BTM PV) reduce demand on the bulk power system operated by ISO New England.
“We’re seeing more behind-the-meter solar every year, and we expect that trend to continue,” said Mike Knowland, ISO-NE’s manager of Forecast & Scheduling. “The 500th duck curve could have come earlier, but there were a lot of cloudy days this year.”
ISO New England observed the region’s first duck curve on April 21, 2018. There wasn’t another one until the following spring. But the frequency of duck curve days has increased each year as the region’s BTM PV capacity has grown.
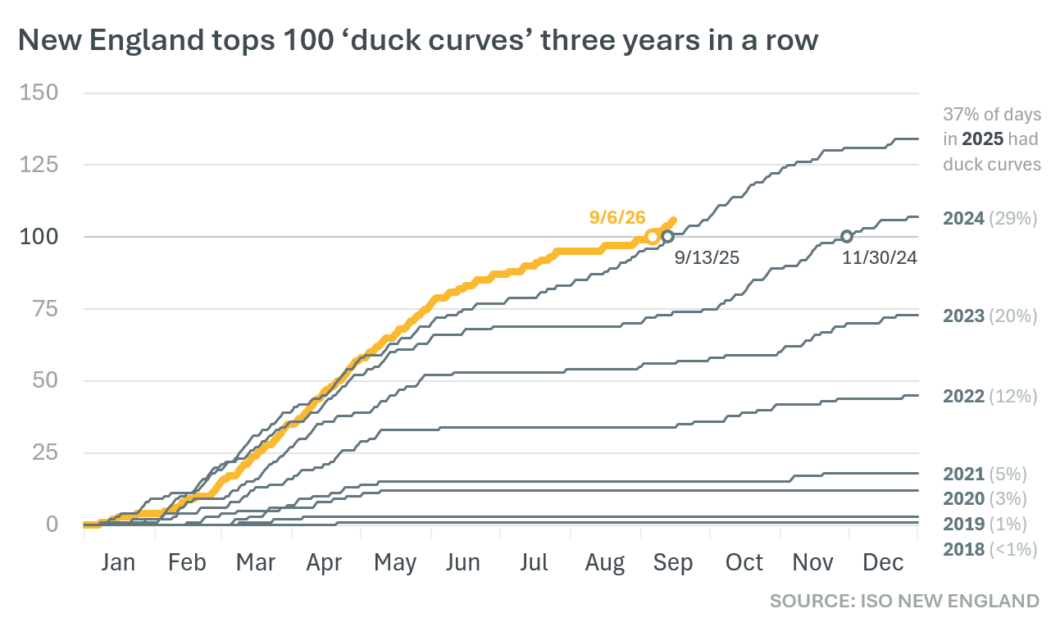
It took nearly five years for the region to accumulate its first 100 duck curve days. But it only took about 13 months to add 100 more. The pace has been increasing ever since, to the point where there were only 221 days between the 400th and 500th duck curves.
The 500th, which happened on Sept. 21, was the 107th duck curve of 2026.
New England has seen at least 100 duck curve days within each calendar year after 2023. And each year’s 100th has arrived earlier than the last. In 2024, the 100th duck curve was on Nov. 30. The next one landed on Sept. 13, 2025. This year’s 100th was on Sept. 6.
Early on, duck curves were most prevalent on spring weekends and holidays. That’s because solar panels tend to be most productive in the spring, and electricity demand tends to be lower outside the workweek and when temperatures are mild. Today, the most pronounced duck curves continue to happen on spring weekends. But the phenomenon can happen in any season and on any day of the week — provided that the sun is shining and that harsher temperatures aren’t driving an uptick in electricity demand from air conditioning or heating.
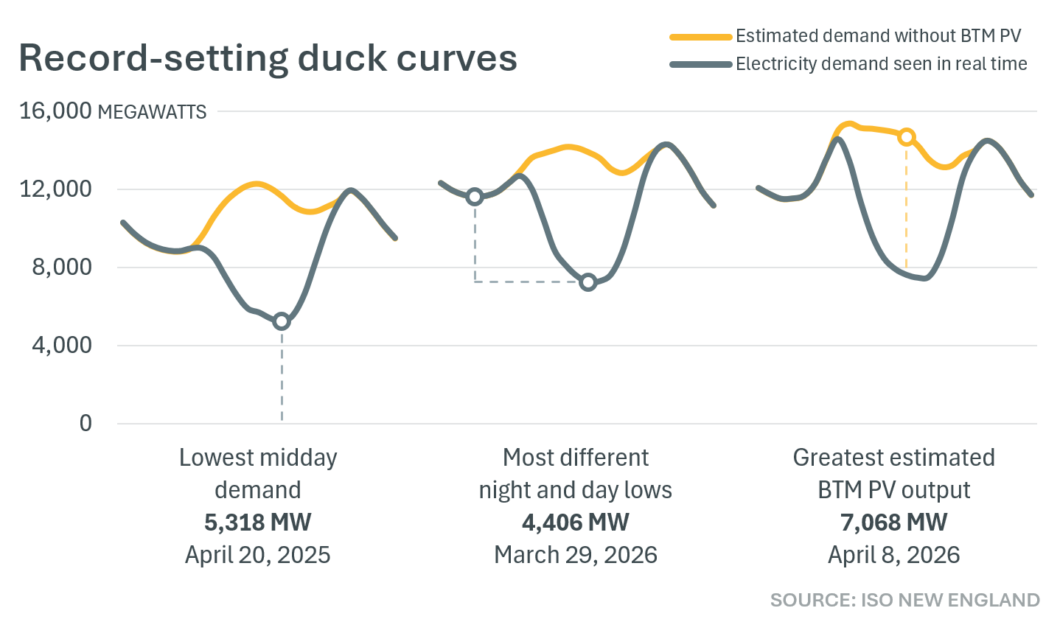
The region’s deepest duck curve to date happened last year. System demand reached a record low of 5,318 megawatts (MW) around 2 p.m. on Easter Sunday, April 20, 2025. Without contributions from BTM PV, the ISO estimates, demand at that time would have been more than twice as high — higher than the actual peak, which didn’t happen until after sunset.
Sunday, March 29, 2026, saw the greatest difference between the overnight and midday lows. Demand dropped to 11,667 MW around 3 a.m. It climbed back up as most New Englanders woke up and began their day. But then it dropped to 7,261 MW around 1 p.m. That’s a difference of 4,406 MW.
BTM PV had its greatest estimated output to date around 1 p.m. on Wednesday, April 8, 2026, at 7,068 MW.
As for getting its ducks in a row, New England’s record for consecutive duck curve days is nine. This has happened twice: March 7-15 and April 17-25, 2025.
Even on days without duck curves, BTM PV provides the region with a considerable amount of energy. The ISO estimates these resources generated 9,926 GWh of electricity in 2025. For comparison, New Englanders consumed 117,744 GWh from the grid that year.
Background
Duck curves are a consequence of the continuing growth of BTM PV, which is made up of solar power systems that do not provide real-time generation data to the ISO’s control room. Examples include residential rooftop solar panels as well as larger-scale solar farms. Most of the solar resources in New England fall into this category.
On sunny days, BTM PV resources supply consumers with a significant amount of electricity. Without BTM PV, consumers would instead get their electricity from resources directly connected to the bulk power system. These include traditional generators like nuclear and natural-gas-fired power plants as well as hydropower and other renewables like grid-connected wind and solar.
Because the ISO does not receive real-time data from BTM PV resources, it must instead estimate how much electricity they produce and when they’re producing it. These estimates are created using a statistical sampling of actual production and advanced software.
Accurate estimates are essential to keeping electricity supply and demand in balance. At times when BTM PV is highly productive, the ISO maintains balance by dispatching other energy resources to reduce output. By the same token, the ISO must direct other resources to ramp up production when BTM PV production decreases, which happens around dusk and whenever clouds roll in.
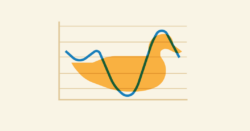
The difference between demand for bulk electricity and estimated demand without BTM PV is illustrated daily in the System Load Graph on ISO Express. Graphs like these are where the duck curve gets its name. When demand drops at midday, then climbs up again in the evening, the curving line resembles the profile of a waterfowl.
Related:
- Categories
- Inside ISO New England
- Tags
- solar, system operations