


Monthly wholesale electricity prices and demand in New England, July 2026

Wholesale power prices averaged $54.66 per megawatt-hour (MWh) in the Real-Time Energy Market in July 2026, down 9% compared to the previous year.1 Day-Ahead Energy Market averages were $66.99/MWh, down 5% from July 2025.
By the numbers
| July 2026 | Percent Change from July 2025 | Percent Change from June 2026 | |
| Average Real-Time Electricity Price | $54.66 per megawatt hour | −9.3% | +7.3% |
| Average Natural Gas Price | $2.71 per MMBtu | −35.9% | +4.2% |
| Peak Demand | 25,832 megawatts (MW) | +2.0% | +13.4% |
| Total Electricity Use | 11,436 gigawatt-hours (GWh) | −6.1% | +15.2% |
Drivers of wholesale electricity prices
In general, the two main drivers of wholesale electricity prices in New England are consumer demand and the cost of fuel used to produce electricity.
Power plant fuel
Natural gas is the predominant fuel in New England, used to generate 54% of the power produced in 2025 by New England’s power plants. As a result, natural-gas-fired power plants usually set the price of wholesale electricity in the region, and average wholesale electricity prices are closely linked to natural gas prices.
The average natural gas price during July was $2.71 per million British thermal units (MMBtu), which was down 36% from the July 2025 average.2 The Mass. index price is a volume-weighted average of trades at four natural gas delivery points in Massachusetts, including two Algonquin points, the Tennessee Gas Pipeline, and the Dracut Interconnect.
Wholesale electricity and natural gas prices

Electricity demand
Demand is driven primarily by weather, as well as economic factors, because changes in weather drive the use of heating and air conditioning equipment. Since air conditioning use is far more widespread than electric heating in New England, weather tends to have a greater impact on electricity use in summer than in winter.
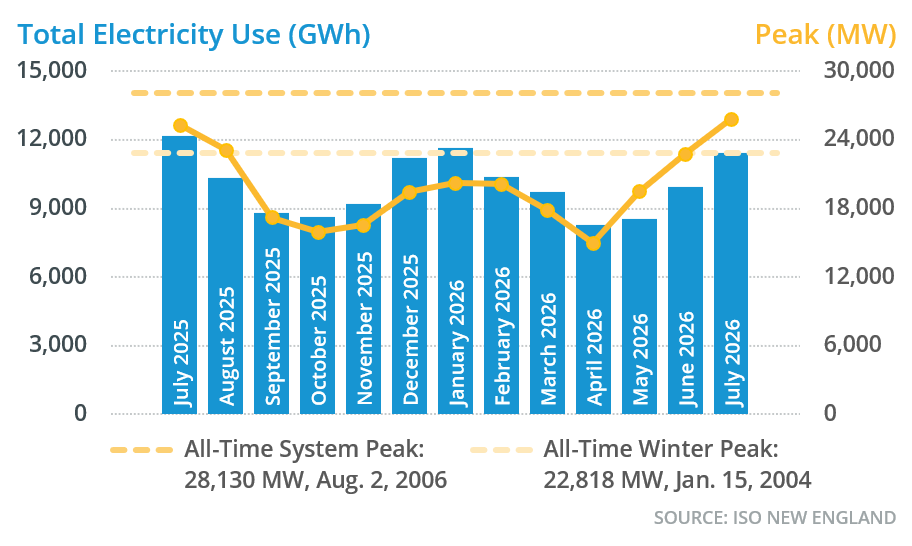
Total demand (or total electricity use) during July 2026 was 11,436 GWh, a decrease of 6.1% from July 2025. The average temperature this July was 73 degrees Fahrenheit (°F) in New England, down 2° from the previous July, while the average dew point, a measure of humidity, was 61°F, down 3° from the previous July. These conditions drove an overall decrease in cooling needs versus the norm for New England.
Like total demand, peak demand is also correlated with the weather. Consumer demand for electricity peaked for the month at 25,832 MW on July 2 during the hour from 6:00 to 7:00 p.m., when the temperature in New England was 96°F and the dew point was 70°F. The July 2025 peak occurred between 6:00 to 7:00 p.m. on July 29, when the temperature was 93°F and the dew point was 65°F.
Monthly total energy use and peak demand
Resource mix and emissions
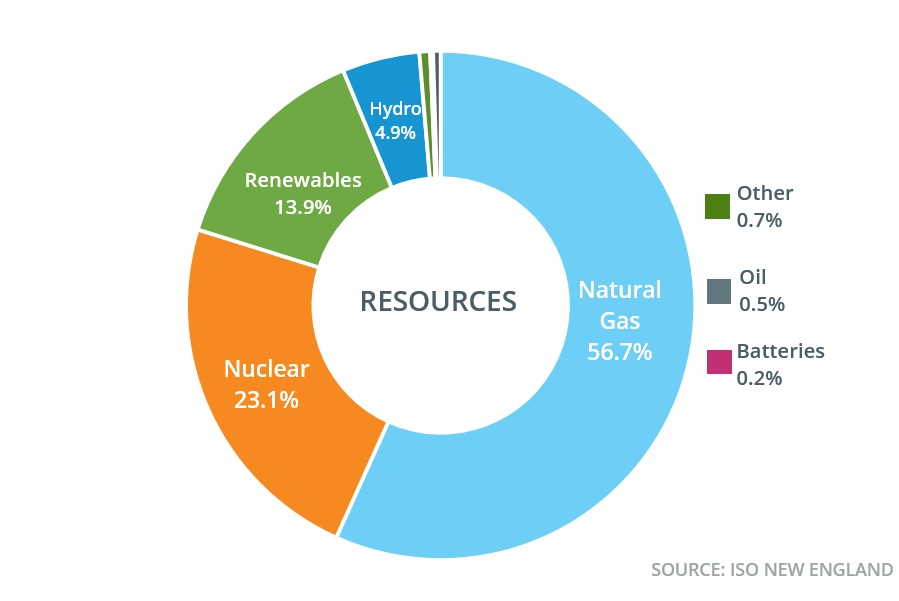
The mix of resources used in any given time period depends on price and availability, as well as supplemental resource commitments needed to ensure system stability. Natural-gas-fired generation produced most of the electricity generated within New England in July, with the remainder generated by nuclear, renewables, hydroelectricity, and a fraction from batteries, oil-fired resources, and other resource types.3 The region also received net imports of about 958 GWh of electricity from neighboring regions.
July generation in New England, by fuel source

The mix of resources used to produce the region’s electricity is a key driver of carbon dioxide (CO2) emissions. The ISO estimates these emissions through an analysis that blends data on electricity generation by fuel type with an emissions factor for each fuel that is based on data from the U.S. Environmental Protection Agency.4 New England power plants produced an estimated 2.92 million metric tons of CO2 in July 2026, a 19% a decrease from the previous July.
July estimated CO2 emissions in New England, by fuel source (metric tons)

Estimated CO2 emissions from natural-gas-fired plants — typically the region’s largest source of power system emissions, due to the significant amount of electricity these resources produce — decreased 18% year over year. These resources accounted for 82% of the power system’s total emissions.
Oil-fired resources produced approximately 1% of the total CO2 emissions in July 2026. Because the region’s wholesale electricity markets select the lowest-priced resources needed to meet demand, oil-fired resources tend to run more frequently when natural gas prices rise, and less frequently when natural gas prices are low.
CO2 emissions from other resources — mostly refuse and wood — accounted for about 17% of the power system’s estimated CO2 emissions, a 5% decrease from July 2025.
By the numbers
| July 2026 Estimated Emissions (metric tons) | |
| Natural Gas | 2,387,145 |
| Refuse, Wood, Landfill Gas, and Methane | 491,617 |
| Oil | 38,868 |
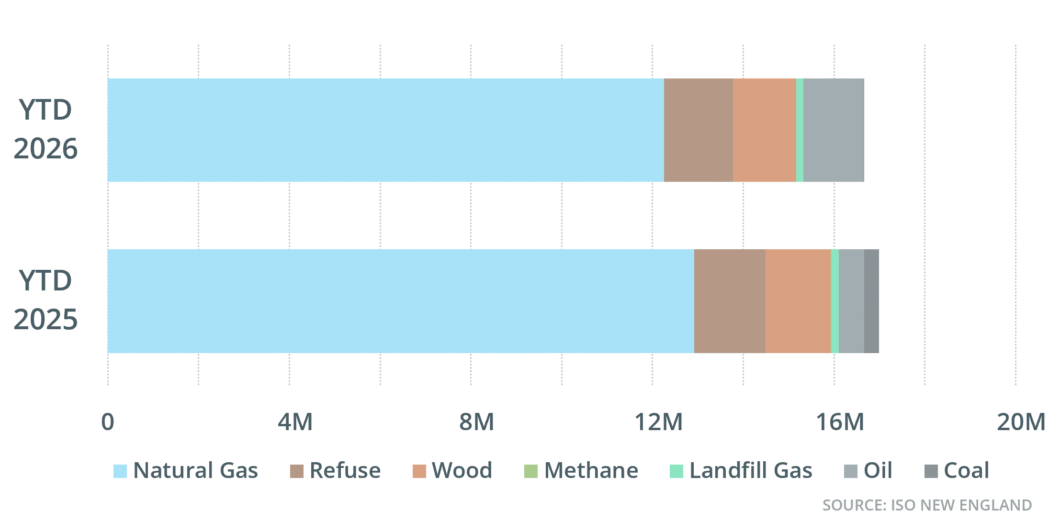
Estimated year-to-date emissions through July 31 decreased 2% year over year. The reduction in year-to-date emissions is driven by several factors, including a slight year-over-year increase in imports. Average annual CO2 emissions from electric generation in the region have declined significantly in the last decade. The ISO New England Electric Generator Air Emissions Reports provide a more comprehensive analysis of New England electric power generator air emissions and a review of relevant system conditions.
July year-to-date estimated CO2 emissions in New England, by fuel source (metric tons)
1. One megawatt (MW) of electricity can serve about 750 to 1,000 average homes in New England. A megawatt-hour (MWh) of electricity can serve about 1,000 homes for one hour. One gigawatt-hour (GWh) can serve about 1 million homes for one hour.
2. A British thermal unit (Btu) provides a uniform standard for comparing the heat value of different fuels. One million British thermal units are shown as MMBtu.
3. Resources that could be included in Other are demand response, hybrid solar/battery, hybrid wind/battery, fuel cells, and geothermal resources.
4. The factors used to estimate CO2 emissions were updated in October 2025. ISO New England analysts regularly review and refine the methodology used to develop these emissions factors in order to reflect the characteristics of New England’s generating fleet and improve the accuracy of the estimates.
- Categories
- Inside ISO New England
- Tags
- monthly prices