


Ebb and flow of wholesale energy prices detailed in ISO-NE charts

This is the latest installment in a series highlighting data visualizations created by ISO New England to help explain different aspects of the region’s bulk electric system.
Variables like the weather, consumer demand, and fuel costs mean the price of wholesale electricity is in constant flux.
This price variation is illustrated in ISO New England’s System and Market Operations Report, a detailed overview of information about the regional power grid. The report is presented to members of the New England Power Pool at monthly Participants Committee meetings, and each month’s slide deck is posted publicly on the ISO-NE website.
Two charts in the report track hour-by-hour variations in locational marginal prices (LMPs), which represent the rates of exchange between buyers and sellers of wholesale electricity.
These charts take a longer view than the Hourly LMP Graph on ISO Express, the ISO’s online data dashboard. While the online graph displays hourly LMPs over the course of a single day, the System and Market Operations Report compares hourly LMPs over the course of nearly a month. Annotations with information about notable results may also be included.
Additionally, while ISO Express presents preliminary data, the data in the System and Market Operations Report have gone through a market settlement process to improve accuracy. The report is prepared at the beginning of each month, often before settlement data for the entire previous month are available.
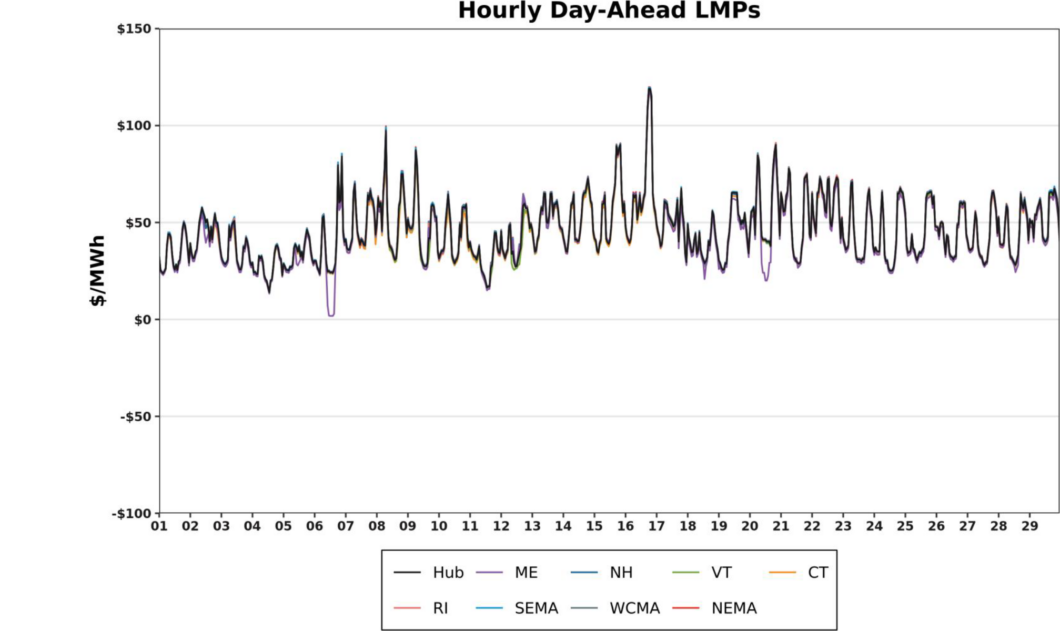
The first chart examines the Day-Ahead Energy Market, which is the foundation of the next day’s system operating plan. The example above covers the period from April 1 to 29.
Different colored lines show LMPs for eight load zones. Each state is its own load zone, except Massachusetts, which is divided into three load zones — northeast (NEMA), southeast (SEMA), and western/central (WCMA). The black line is for the Hub, which provides a representative price for the entire region. Most of the time, all nine lines are closely correlated. LMPs in the Real-Time Energy Market reflect actual system conditions and may differ from day-ahead LMPs.
The example below, also from April 1 to 29, points out times where LMPs dipped below $0 per megawatt-hour. Instances of negative pricing may arise when there is surplus energy. That was true on multiple occasions in Maine, resulting from constraints on its transmission interface with New Hampshire. And it happened systemwide on a day when behind-the-meter solar generation reduced demand more than expected.

- Categories
- Inside ISO New England
- Tags
- wholesale markets