Charts highlight contributions from small but growing resource types
This is the latest installment in a series highlighting data visualizations created by ISO New England to help explain different aspects of the region’s bulk electric system.
There’s a diverse set of energy resources that supply a relatively small amount of energy to New England’s power grid. But some of these resources are poised for growth, and all of them make crucial contributions to system reliability. So they’re worth zooming in on.
Output from these resources is broken down in ISO New England’s System and Market Operations Report, a detailed overview of information about the regional power grid. The report is presented to members of the New England Power Pool at monthly Participants Committee meetings, and each month’s slide deck is posted publicly on the ISO-NE website.
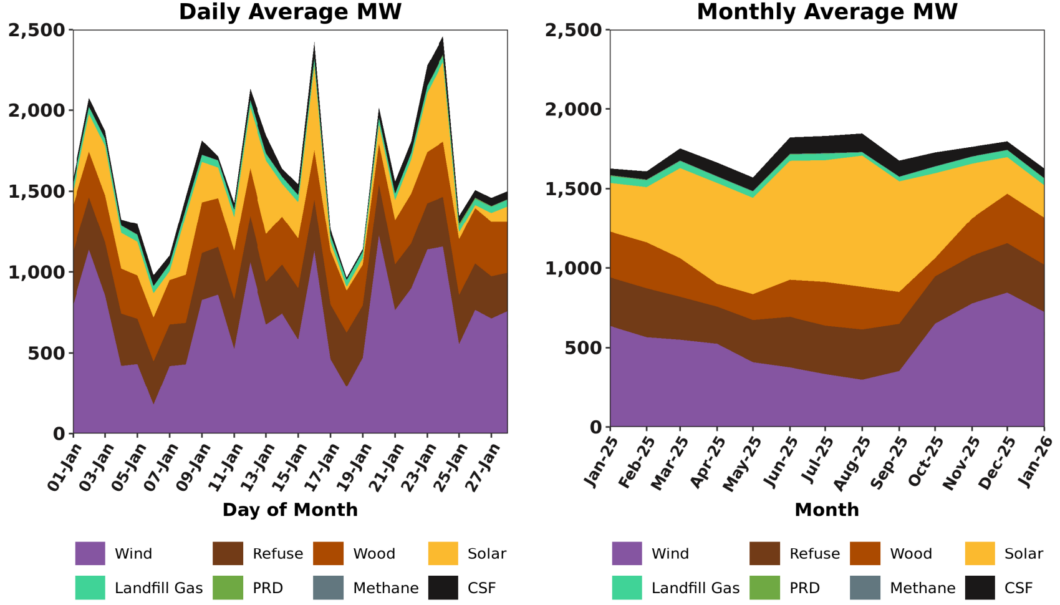
The report’s “Renewable Generation by Fuel Type” slide includes two stacked area charts displaying multiple resource types’ average output, in megawatts (MW), on a daily and monthly basis.1 Each resource type is represented by a different color.
Purple represents wind resources, including both offshore and land-based turbines. Yellow represents grid-connected solar resources. Behind-the-meter photovoltaics (BTM-PV), which are invisible to the ISO-NE control room, are only partially reflected in the chart, depending on whether they participate in the energy markets.
As the Monthly Average MW chart demonstrates, solar is more productive during the summer and less productive during the winter, while the opposite is true for wind. Both resource types are highly weather-dependent, and so their output can change dramatically from one day to the next, as the Daily Average MW chart shows.
Daily and monthly output is more consistent from the other resource types presented here. The New England states consider refuse (dark brown), wood (light brown), landfill gas (aquamarine), and methane (gray) to be renewable resources. These resources do, however, produce carbon emissions. Together, they accounted for about 4% of the electricity New Englanders consumed in 2025. Methane was just a tiny fraction of that amount, and so it is not visible in the charts.
Continuous storage facilities (CSF, in black) include grid-connected battery energy storage systems. These resources typically draw energy from the grid during times of lower demand, and supply energy to the grid during times of higher demand. Contributions from battery storage are expected to grow in the coming years. Nearly half of the megawatt capacity in the ISO’s Interconnection Request Queue is made up of battery storage projects.
Price-responsive demand (PRD, in green) is also known as demand response. It represents electricity customers who are compensated in the region’s wholesale electricity markets for reducing consumption in response to dispatch instructions. Because demand response resources typically bid into the markets at high prices, they are activated infrequently and usually are not visible in the charts. Price-responsive demand accounted for the equivalent of 0.008% of energy used to meet demand in New England in 2025.
- The chart reflects revenue quality metering, which includes output from many small resources not visible to ISO-NE control room operators during real-time operations. Output levels reported here may be higher than real-time telemetered information presented on ISO Express. ↩︎
- Categories
- Inside ISO New England
- Tags
- renewable resources, system operations