Electricity imports, exports tracked on External Interfaces Graph
This is the latest installment in a series highlighting data visualizations created by ISO New England to help explain different aspects of the region’s bulk electric system.
New England is a net importer of electricity. From 2015 to 2024, an average of 16% of the electricity consumed within the six states was generated outside the region.
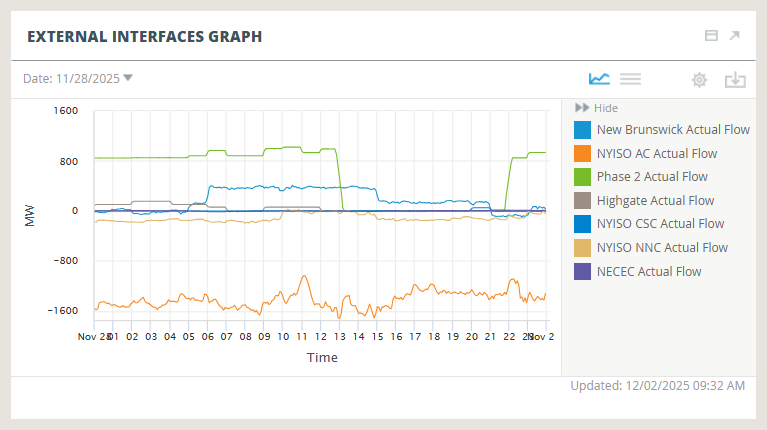
That’s on an annual basis. In real time, things are more complicated. Throughout each day, electricity flows into and out of New England over multiple tie lines in constantly changing quantities. The External Interfaces Graph, part of the ISO Express data dashboard and ISO to Go mobile app, captures this variability.
The graph depicts electricity flow at five-minute intervals, using a different color for each of seven external interfaces. For any given interface, a positive megawatt quantity represents electricity being exported, while a negative megawatt quantity represents electricity being imported. Interfaces may be inactive at times, reflected in a zero-megawatt reading.
For scheduling and pricing purposes, multiple tie lines may be bundled into one interface. Two tie lines between northeastern Maine and its neighboring Canadian province make up the New Brunswick interface. Nine ties to New York are divided among three interfaces labeled NYISO AC, NYISO NNC, and NYISO CSC. The remaining three tie lines connect to Québec, each constituting its own interface: Phase 2, Highgate, and the recently added New England Clean Energy Connect (NECEC).
What determines whether a given interface is importing, exporting, or inactive? That’s a function of agreements between producers and distributors of electricity as well as the competitive energy markets in New England and its neighboring regions.
A market participant may own a resource outside New England but sell the electricity it generates inside New England. Conversely, a market participant might own a resource inside the region but have a contract to sell the power it generates to a customer somewhere else.
Market participants may also watch the markets for opportunities to make a profit by importing or exporting. If energy prices are higher in New England than in neighboring regions, an outside generator may offer to sell its electricity here rather than there. By the same token, if prices are higher outside New England, generators here may offer to export. Prices tend to drop when electricity demand is low or supply is abundant. Prices climb when demand increases or supply is scarce.
Prices at each interface are shown on the ISO Express LMP Map as well as the ISO to Go Price Map. The sum of import and export quantities is displayed in the ISO Express Resource Mix Graph.
- Categories
- Inside ISO New England
- Tags
- imports, website