Carbon emissions from New England power generation relatively unchanged between 2023 and 2024, ISO-NE analysis finds

Electricity generation within New England produced 1% more carbon dioxide (CO2) in 2024 than the previous year, according to estimates included in ISO New England’s latest annual analysis of power system emissions.
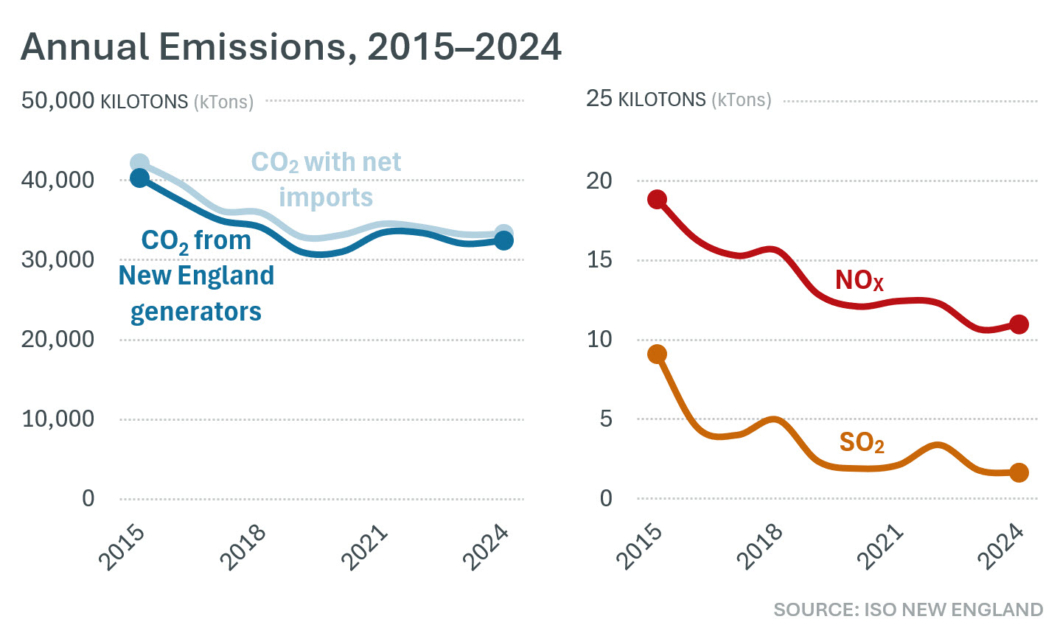
Higher natural gas generation drove the slight increase in CO2 emissions, and a 3% increase in total nitrogen oxides (NOx). Total sulfur dioxide (SO2) decreased by 8%, according to the 2024 ISO New England Electric Generator Air Emissions Report.
The analysis, which draws information from Environmental Protection Agency (EPA) databases and other sources, found that New England’s current power system emissions are well below those observed in the early 2000s and 2010s. Carbon dioxide emissions declined 20% between 2015 and 2024.
Report takeaways
Similar seasonal patterns between 2023 and 2024 kept year-over-year changes in carbon emissions relatively small.
Both 2023 and 2024 were characterized by mild winters and summers with few periods of tight system conditions. New England wholesale electricity demand was just 2% higher in 2024 than the historically low demand of the previous year. The region often relies on higher-emitting oil- and coal-fired generation to meet increased demand for cooling on very hot days, or to make up for natural gas pipeline constraints that can occur in very cold weather. These resources typically drive emissions higher.
Drought and extended nuclear outages in Canada contributed to a reduction in imports.
Ongoing drought in Québec, affecting hydropower, and an extended outage of nuclear resources in New Brunswick from April to December 2024 drove an overall reduction in Canadian imports. This contributed to an 8% increase in natural gas production year over year.
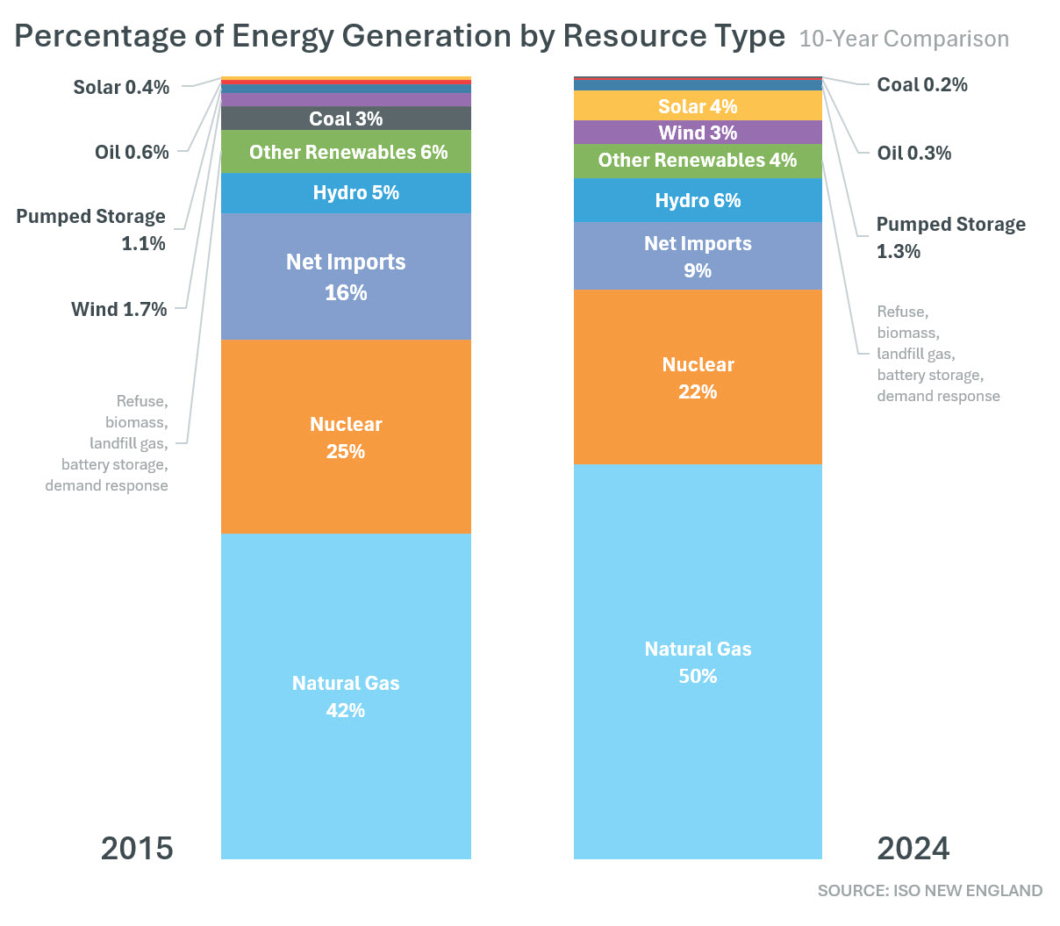
Increase in renewables continues, while nuclear returned to more normal operations.
Over the last 10 years, wind and solar generation in the region has more than doubled, making up 7% of the total energy generated in 2024. Wind and solar generation have now effectively replaced most coal and oil generation. Coal and oil generated just 0.5% of the total energy in 2024, compared to 3.6% in 2015. Nuclear, another key non-emitting resource type, returned to normal operations in 2024 after multiple planned refueling outages in 2023.
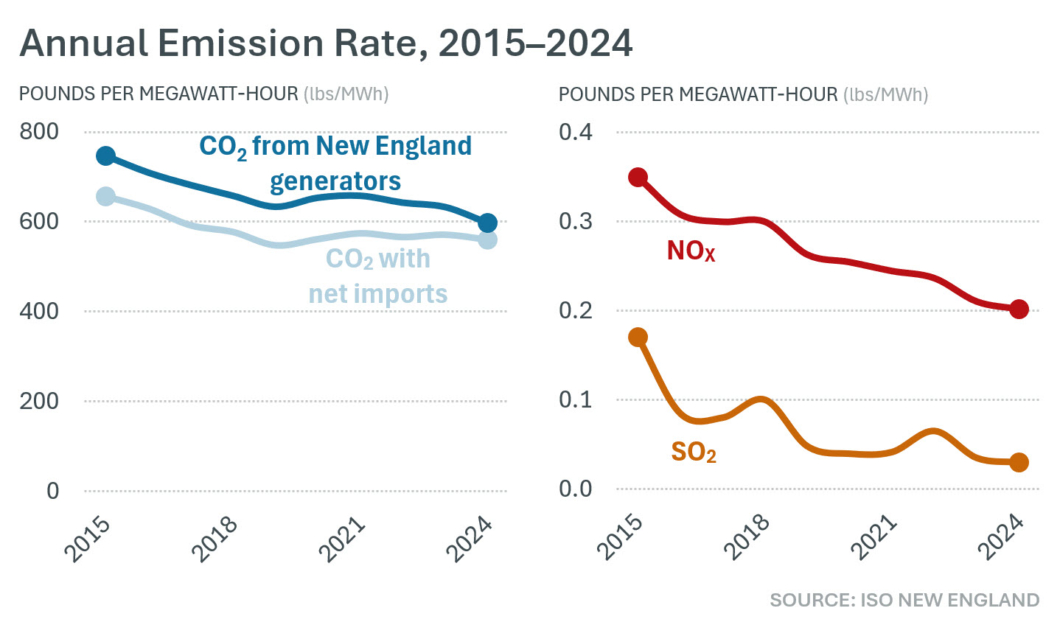
Emission rates for CO2, SO2, and NOx, which describe how many pounds of each pollutant are given off for every megawatt-hour (MWh) of electricity produced, have seen double-digit declines over the past decade, dropping 20%, 82%, and 42% respectively. Emission rates were flat or down from 2023 to 2024.
By the numbers
The table below summarizes annual average emissions and emission rates for 2024, as well as the year-over-year changes from 2023. The table includes figures for emissions from New England generation, as well as data on emissions associated with New England generation plus electricity imported from other regions. More detailed results can be found in the report’s appendix.
| New England generation | 2024 emissions (kilotons) | 2023 emissions (kilotons) | Change from 2023 to 2024 | 2024 emission rate (lbs/MWh) | 2023 emission rate (lbs/MWh) |
| NOx | 10.96 | 10.66 | +3% | 0.20 | 0.21 |
| SO2 | 1.62 | 1.77 | −8% | 0.03 | 0.03 |
| CO2 | 32,442 | 32,050 | +1% | 597 | 633 |
| New England generation and imports | |||||
| CO2 | 33,293 | 33,215 | +0.2% | 560 | 571 |
About the data
The report’s emissions estimates for generation within New England are based on data from the EPA’s Clean Air Markets Program database and the agency’s eGRID database, New England Power Pool Generator Information System monthly data, or the ISO’s calculation of emission rates based on unit type and age. CO2 emission rates for imports are based on data from the eGRID database for the New York ISO and on Canada’s Greenhouse Gas Inventory Report. Some data sources are not available until several months after the end of a calendar year.
In addition to the annual analysis, ISO-NE publishes data on estimated CO2 emissions from New England power plants in a monthly recap of the wholesale electricity markets. Real-time estimates are available on ISO Express and the ISO to Go app.
- Categories
- Publications
- Tags
- environment