Region’s 100th ‘duck curve’ day migrates to early fall
In 2024, it took until after Thanksgiving for New England to rack up 100 duck curve days, when demand for wholesale electricity is lower at midday than overnight.
This year, as the expansion of “behind-the-meter” solar power continues reducing daytime demand, the 100th duck curve happened closer to Labor Day.
The region’s 100th duck curve day was Saturday, Sept. 13. Around 11:00 a.m. demand dropped to 8,637 megawatts (MW). This was nearly 7% lower than the overnight minimum load of 9,321 MW at about 4:00 a.m. And it was significantly lower than the evening peak of 13,653 MW at about 7:00 p.m.
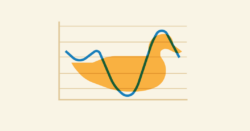
The drop in demand from overnight to midday, followed by the evening climb, is what gives the duck curve its name. Plotted as a line graph, the change in energy use throughout the day resembles the profile of a waterfowl.
New Englanders historically have used the least energy overnight, when most of them are asleep. But since 2018, it has become increasingly common for demand to fall even lower when the sun is shining. That’s because behind-the-meter photovoltaic (BTM PV) resources supply energy that would otherwise come from resources on the grid. For example, on Sept. 13, ISO New England estimates that BTM PV was providing about one-third of the region’s electricity at midday.
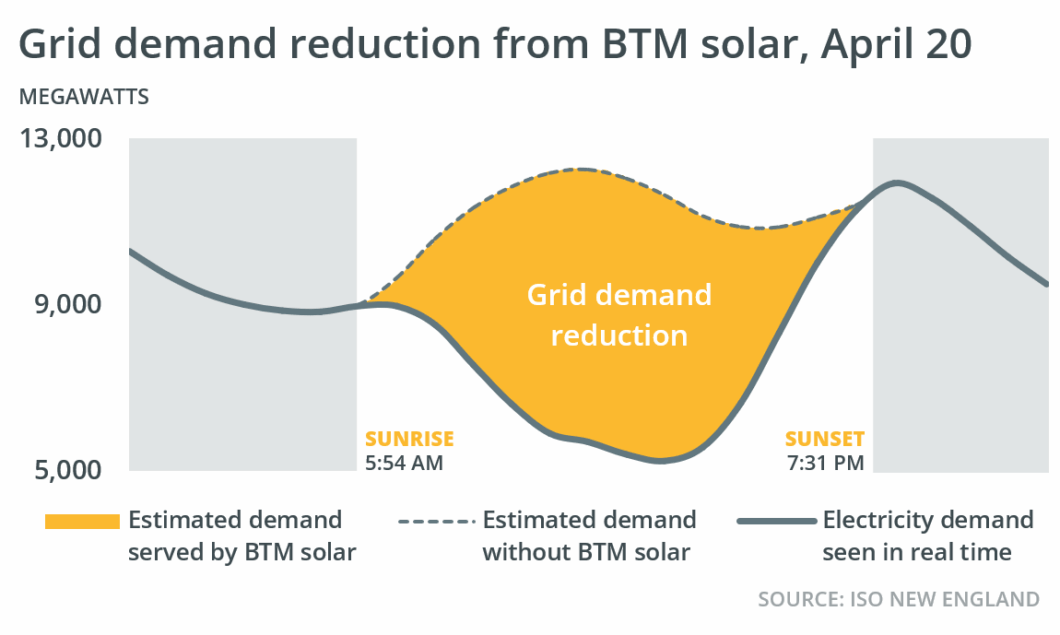
The region’s deepest duck curve to date happened this spring on April 20, when system demand reached an all-time low of 5,318 megawatts (MW). Without contributions from BTM PV, the ISO estimates, demand at that time would have been more than twice as high.
Duck curve days can happen any time of year, but they are most frequent in the spring. That’s when solar output tends to be highest, and when mild temperatures mean people use less electricity for heating and air conditioning. This year, New England had 20 duck curve days in March alone — the most of any month to date. That compares to six duck curves in July, the smallest number in any month so far this year.
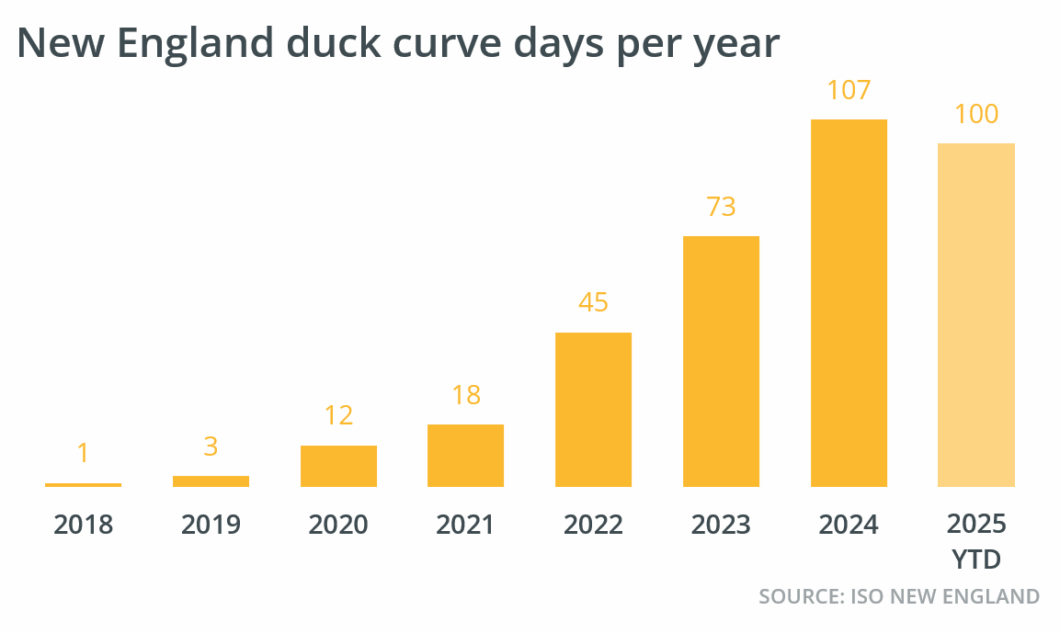
The number of duck curve days has been increasing steadily each year ever since the first one was observed April 21, 2018. In 2024 there were a total of 107 duck curve days, with the 100th occurring on Nov. 30. This year is likely to have several more duck curve days, especially as autumn sets in.
- Categories
- Inside ISO New England
- Tags
- solar