Five-Minute Real-Time LMP Graph captures variability of wholesale electricity prices
This is the latest installment in a series highlighting data visualizations created by ISO New England to help explain different aspects of the region’s bulk electric system.
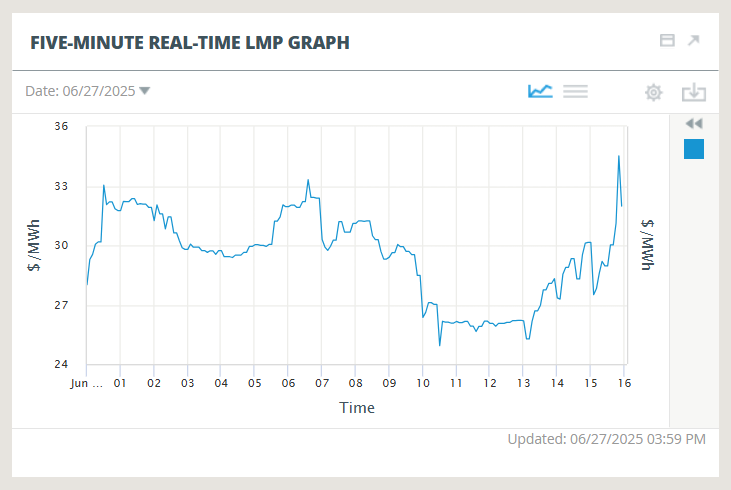
The price of wholesale electricity constantly changes throughout the day, driven by factors including consumer demand and the cost and availability of fuel. The Five-Minute Real-Time LMP Graph, a component of the ISO Express data dashboard, captures this variability.
LMP stands for locational marginal price. It reflects the rates of exchange between buyers and sellers of wholesale electricity. In this chart, values are updated every five minutes as transactions happen in the Real-Time Energy Market. This differs from the Hourly LMP Graph, which uses a different time scale and includes prices in the day-ahead markets.
The graph’s default view displays the real-time Hub LMP, which is a representative price for the entire region. By clicking the gear icon, users may choose to display LMPs for any of the region’s eight load zones and seven import/export interfaces. Users may also choose to display data for the three components of LMPs:
- Energy—the cost of producing the electricity that flows over the region’s transmission system
- Congestion—costs related to constraints on the transmission system that limit the free flow of electricity
- Loss—costs due to the portion of energy lost in transit in the form of heat
The Five-Minute Real-Time LMP Graph includes features allowing users to select any day from the past two years and to toggle between a line chart and tabular data. The same features are available on several other ISO Express data modules.
- Categories
- Inside ISO New England
- Tags
- wholesale prices