Sunny spring days push grid demand to new lows
Nearly half of all days so far this year have seen lower demand for grid electricity during daylight hours rather than overnight—a sign of the increasing impact of behind-the-meter solar power.
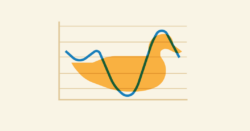
Out of 151 days from Jan. 1 to May 31, 69 were “duck curve” days. Duck curve is a term applied to line graphs showing electricity demand for a given day. When there’s a pronounced drop in demand for grid electricity in the middle of the day, the line somewhat resembles the profile of a waterfowl.
Duck curves are notable because grid demand historically has reached its lowest levels during the overnight hours, when most people are asleep and not using much electricity. But over the past few years, it has become increasingly common for the point of lowest demand to happen when the sun is shining. That’s because behind-the-meter photovoltaic (BTM PV) resources supply energy that would otherwise come from resources on the grid.
Output from BTM PV increases gradually after sunrise, decreases gradually before sunset, and fluctuates throughout the day depending on cloud cover and other factors. No matter how sunny it is, ISO New England ensures a reliable flow of electricity at all times by proactively instructing grid-connected resources to raise or lower their output as needed to maintain the instantaneous balance of power supply and demand.
Deepening impact
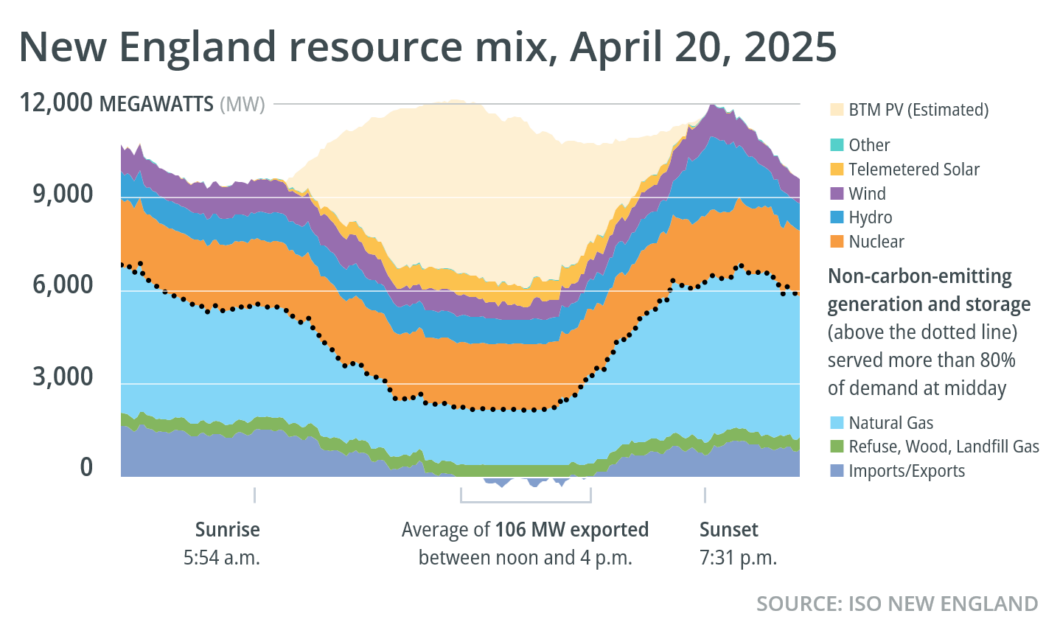
New England’s deepest duck curve to date was on April 20, when system demand reached an all-time low of 5,318 megawatts (MW). Of the region’s 25 lowest-demand days, 16 are from 2025.
Operations data from April 20 paint a picture of how contributions from BTM PV can affect the resource mix.
ISO New England follows a process called economic dispatch to select the lowest-priced resources necessary to meet demand at any given time. Throughout the day on April 20, demand and wholesale prices were relatively low—so more expensive resource types like oil and coal did not operate at all. Before sunrise and after sunset, more than 50% of demand was met by carbon-emitting sources, primarily natural gas generators, as well as imports from neighboring regions, which are assumed to have associated emissions.
During the day, the resource mix shifted. Natural gas output decreased. Imports also diminished, and at times New England was a net exporter of electricity. At noon, more than 80% of the total electricity used in the region came from non-emitting resources: primarily BTM PV, but also grid-connected resources like nuclear, hydro, wind, and telemetered solar. A small amount came from resources in the “other” category, which includes battery storage systems and demand response.
Increasing frequency
The 69 duck curve days recorded as of May 31 is the greatest number by that point in any year so far.
New England’s first duck curve day was April 21, 2018, when demand hit a low of 9,860 MW. There were no other duck curves that year. But the count has steadily increased each year since then as the region’s BTM PV capacity grows. In 2024, there were 107 duck curve days, 64 of them before June.
Historically, duck curves have been concentrated in the spring. That’s when solar output tends to be highest. It’s also a time of relatively low demand because New Englanders aren’t using as much electricity for heating and cooling.
Duck curves were once most common on weekends and holidays, when demand tends to be lower than during the work week. The deepest duck curves of this year and 2023 both occurred on Easter. However, in 2025, weekday duck curves have been just as common as weekend duck curves. March 2025 had 20 duck curve days, the most of any month to date. There were 18 in April and 12 in May.

- Categories
- Inside ISO New England
- Tags
- resource mix, solar, system operations