100th ‘duck curve’ day marks New England solar power milestone

As Thanksgiving approaches, power grid operators at ISO New England aren’t thinking about turkey.
This year, it’s all about the duck.
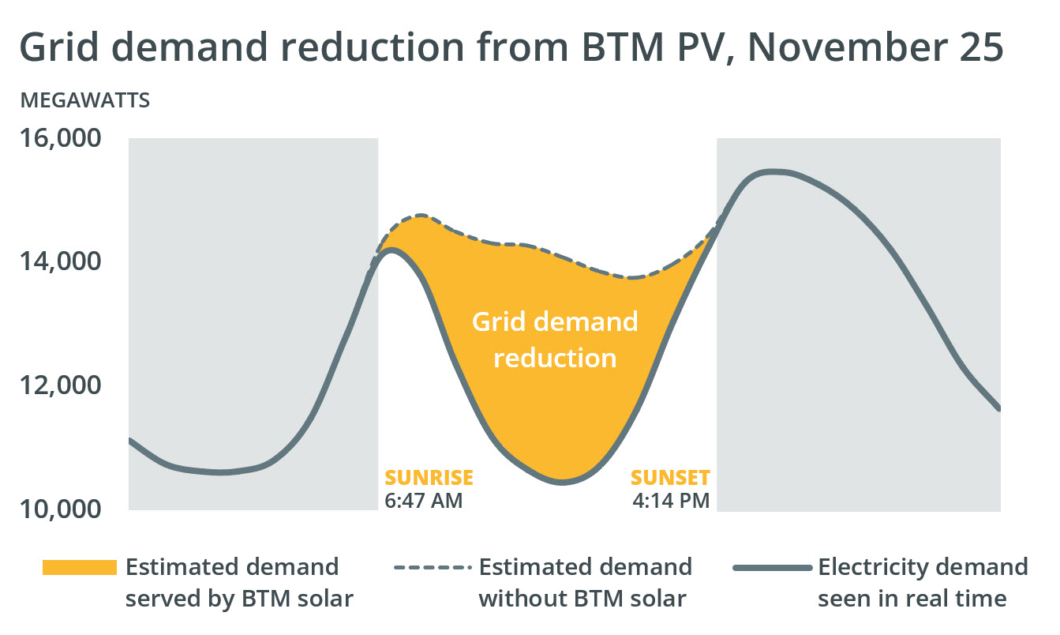
That’s because the region recorded its 100th “duck curve” day of 2024 on Monday, Nov. 25.
Duck curve is a term used to describe the once-rare phenomenon of demand on the electric grid being lower at midday than it is overnight. When represented as a line graph, the ebb and flow of demand somewhat resembles the profile of a waterfowl.

The phenomenon is most common during weekends in the spring, but it can happen anytime there’s a sunny day with relatively mild temperatures. Duck curves happen when behind-the-meter photovoltaics (BTM PV) serve a large portion of the region’s demand for electricity, reducing demand for electricity that’s transmitted over the regional power grid. If New Englanders aren’t using much electricity for heating or cooling, grid demand can drop significantly.
Duck curve days are becoming more frequent as more New England homeowners and businesses install solar power systems. But duck curves are not disruptive from a grid operations perspective. Staff in the ISO’s control room keep the entire system in balance by instructing the region’s other energy resources to decrease production when BTM PV output is high, and to increase production when BTM PV output is low.
At 100 duck curve days, 2024 already far outpaces previous years. In 2023 there were 73 duck curve days, and there were 45 the year before that. Duck curves have been steadily increasing since ISO New England first observed the phenomenon in 2018.
In addition to the 100 days milestone, three of 2024’s duck curves were remarkable for their record-setting attributes.
New England saw its lowest recorded midday load on Saturday, April 27, when demand for grid electricity plunged to 6,596 megawatts (MW). For comparison, demand in April averaged about 11,000 MW.
The greatest estimated output from behind-the-meter solar came to 6,092 MW on April 25. That represents an hour during which nearly all of the region’s estimated BTM PV capacity was operating at close to maximum output.
And the greatest difference between midday and overnight demand was observed on Saturday, March 30, at 3,134 MW.
So far this year, February had the most duck curve days, 19. March and April both had 16. On the other end of the spectrum, August had only one duck curve day, and July had none.
November has had 10 duck curve days so far. There is the potential for several more duck curve days before the year is out.
- Categories
- Inside ISO New England
- Tags
- clean energy, solar, system operations
