Winter 2023/2024 recap: Warm weather, low peak demand contribute to lowest wholesale electricity prices in four years
New England’s bulk power system operated reliably through the winter of 2023/2024, a season marked by warm weather and low wholesale energy prices.
By the numbers
| Winter 2023/2024 | Winter 2022/2023 | Percent +/- | |
| Average Real-Time Electricity Price ($/megawatt-hour) | $44.39 | $79.53 | -43.5% |
| Average Natural Gas Price ($/MMBtu[1]) | $4.82 | $8.93 | -46% |
| Energy Market Value | $1.6 billion | $2.6 billion | -38.4% |
| Total Electricity Use | 30,401 GWh | 29,958 GWh | 1.5% |
Lowest peak in more than 35 years
Peak electricity demand for the winter of 2023/2024 came on January 17, reaching 18,431 MW in the hour between 5 and 6 p.m., when the average temperature in the region was 22°F. That’s the lowest winter peak in New England since the winter of 1986/1987. It was 6% lower than last winter’s peak of 19,756 MW, set on February 3, 2023, when temperatures averaged 4°F.
As a whole, this winter was almost 5°F warmer than normal in the region, in line with seasonal forecasts from the National Oceanic and Atmospheric Administration. The region saw only one notable cold stretch, from January 15 to 22, when temperatures averaged 5°F colder than normal.
New England saw its highest winter demand almost two decades ago—a peak of 22,818 MW during a cold snap in January 2004. New England remains a summer-peaking system because the use of air conditioning drives demand to its highest levels of the year. The region’s all-time peak of 28,130 MW was set in August 2006. However, as the New England states push to electrify the heating sector, the ISO projects the region will become a winter-peaking system in the mid-2030s.
Overall consumer demand was up slightly, reaching 30,401 gigawatt-hours (GWh) during the three-month period—a 1.5% increase over last winter.
Wholesale electricity prices
The cost of wholesale electricity decreased significantly year over year in the region. The wholesale energy market was valued at $1.6 billion in the winter of 2023/2024, down from the previous year’s $2.6 billion and $3.7 billion the year before.
That drop was in line with a 46% decline in the price of natural gas, from $8.93 per million British thermal units last winter to $4.82 this winter. Natural gas is the predominant energy fuel in New England.
For the winter, real-time wholesale electricity prices averaged $44.39 per megawatt-hour (MWh). That’s down 43.5% from $79.53 for the winter of 2022/2023.
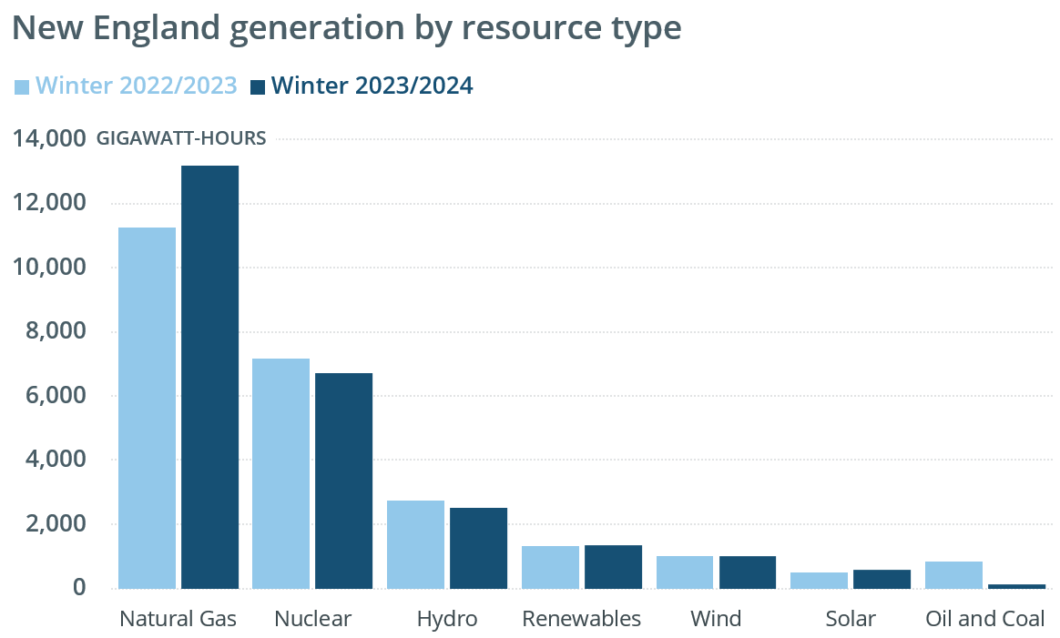
Fuel mix and emissions
Natural gas accounted for 13,165 GWh, or 52% of grid electricity generated in New England this winter. Nuclear power plants produced 26% of the region’s electricity. Coal- and oil-fired generation combined accounted for less than half a percent of all the electricity produced within New England.
Hydroelectric resources accounted for 10% of the region’s generation this winter, compared to 11% last winter. Production from grid-connected solar resources accounted for 2.2% of the region’s generation, while wind was roughly the same from winter to winter at 4%. Other renewables, including wood, refuse, landfill gas, and methane, produced 5.3% of the region’s electricity this winter.
New England received net imports of about 5,700 GWh of electricity from neighboring regions from December through February, down from about 6,300 GWh the previous winter.
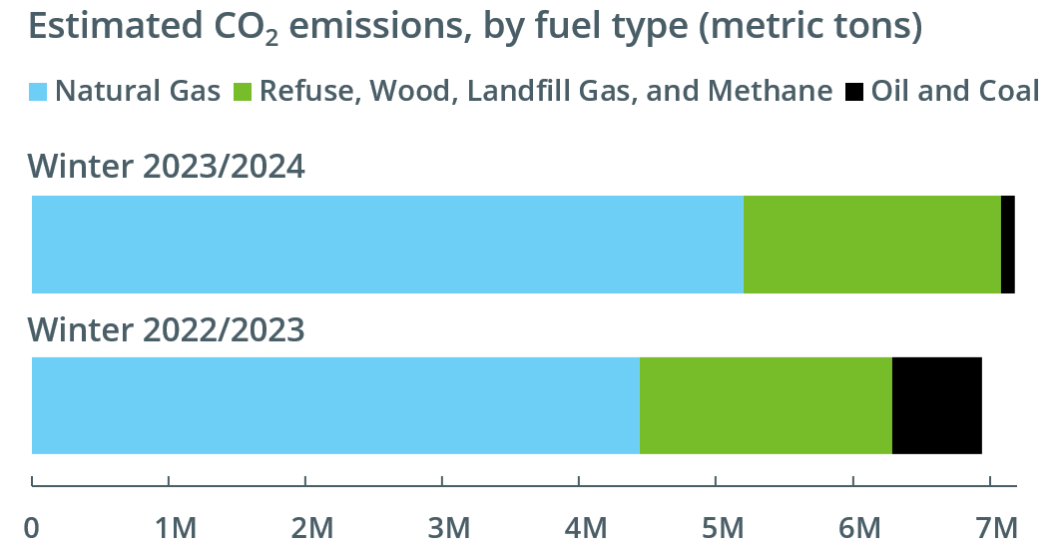
The mix of resources used to produce the region’s electricity is a key driver of CO2 emissions. The ISO estimates these emissions through an analysis that blends data on electricity generation by fuel type with an emissions factor for each fuel that is based on data from the Environmental Protection Agency.[2]
From December through February, CO2 emissions from New England power plants were up about 4% from the previous winter, rising from an estimated 6.9 million metric tons to about 7.2 million metric tons. The increase was due in part to higher demand in January, as well as a decrease in generation by the region’s nuclear fleet.
An increase in generation from natural gas plants meant a 17% increase in emissions from these resources. At an estimated 5.2 million metric tons of CO2, they accounted for 72% of the regional total. Oil-fired generators produced about 107,000 metric tons of CO2 this winter, a drop of about 84% from last winter’s total of more than 650,000 metric tons. These resources accounted for 1.5% of the total.
CO2 emissions from refuse, wood, landfill gas, and methane rose 2%. At an estimated 1.9 million metric tons, they accounted for 26% of the region’s total.
[1] A British thermal unit (Btu) is used to describe the heat value of fuels, providing a uniform standard for comparing different fuels. One million British thermal units are shown as MMBtu.
[2] The factors used to calculate estimated CO2 emissions were updated in January 2024. ISO New England analysts regularly review and refine the methodology used to develop these emissions factors, in order to reflect the characteristics of New England’s generating fleet and improve the accuracy of the estimates.
- Categories
- Inside ISO New England
- Tags
- natural gas, solar, system operations, wholesale markets, wholesale prices, winter