‘Duck curve’ days becoming more frequent as solar power spreads

For decades, demand on the regional power grid has been consistently lowest overnight. But that’s changing as the growth of solar power in New England drives down demand for grid electricity during daylight hours.
In 2023, there were 73 days during which grid demand was lower during the day than it was at night. That number is up from 45 in 2022. Before that, the phenomenon occurred 34 times dating back to April 21, 2018, the first time ISO New England observed it.
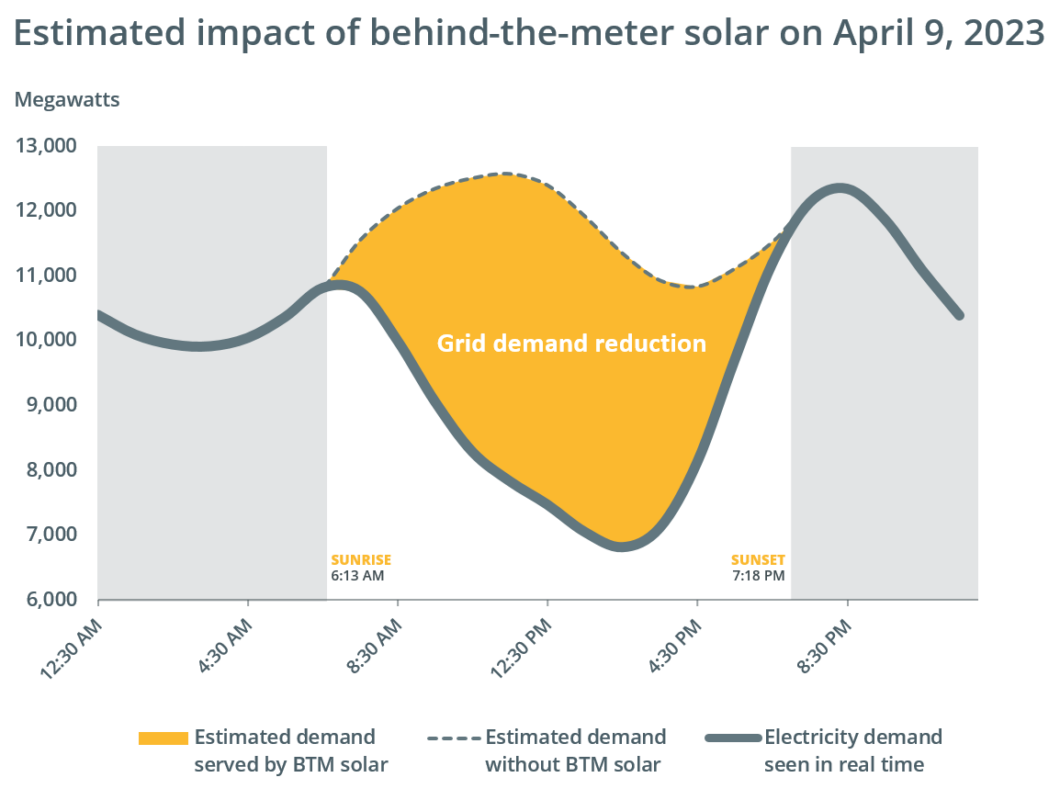
Days like this are referred to as “duck curve” days. That’s because a line chart representing grid demand on such days has a pronounced dip in the middle, somewhat resembling the profile of a waterfowl. That dip represents hours during which homes and businesses are consuming electricity from photovoltaic (PV) installations that reduce grid demand. At times like this, less generation is needed from grid-connected resources—typically power plants that run on natural gas, oil, and coal, and sometimes wind turbines. To date, New England’s biggest duck curve day was April 9, 2023, Easter Sunday. Demand for grid electricity that day hit a low of 6,814 megawatts (MW) between 2 and 3 p.m. That’s more than 3,000 MW less than the overnight minimum load.

Predicting PV’s impact
Understanding the interplay between solar power and the grid is crucial to the reliable operation and planning of the bulk power system.
As of the end of 2022, ISO New England estimates, the region had just over 6,000 MW in nameplate capacity of all types of PV.1 Only about a tenth of that amount is telemetered, meaning that ISO system operators can monitor its output in real time.
To estimate the day-to-day impact of the region’s remaining, behind-the-meter solar capacity, the ISO uses and continually refines sophisticated forecasting tools. Forecasters blend various data sources and call on their own experience to produce an accurate estimate of how much grid demand will be reduced by PV throughout a given day. With that information, the ISO can appropriately schedule other resources to provide power when the sun goes down, when clouds roll in, or when snowfall covers a significant share of PV panels.
By the numbers
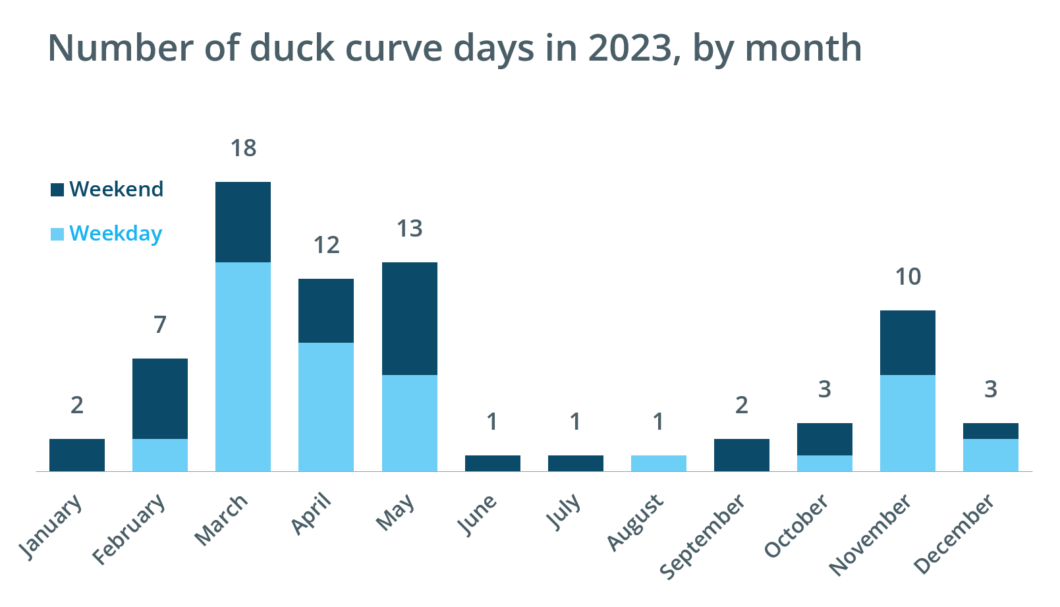
Duck curve days can happen any time of year, given the right conditions. The first duck curve day in 2023 occurred January 8, and the last was December 22. Daytime demand minimums were recorded at least once each month.
March led the pack with 18 duck curve days, 13 of which fell on weekdays. May had four duck curve days in a row, from Friday the 26th to Monday the 29th. June, July, and August—summer months when the use of air conditioning typically pushes demand to the highest levels of the year—each had only one duck curve day.

Several factors aligned on April 9 to yield record-low demand.
Production from behind-the-meter PV was estimated at more than 4,500 MW throughout much of the afternoon. Solar installations tend to be most productive in spring, when the sun’s position in the sky is optimal and trees haven’t yet sprouted leaves that will block some sunlight. Additionally, solar cells work best in cooler weather, losing efficiency in the heat and humidity of summer.
Meanwhile, temperatures on April 9 were mild, meaning consumers weren’t using much electricity for heating or cooling. Finally, weekend days typically see lower electricity use than weekdays, and the Easter holiday has historically led to even lower demand.
All signs point to duck curve days becoming more prevalent in the coming years. There were 14 duck curve days by February 20, 2024. By the same date in 2023, there had been nine duck curve days. The ISO’s long-term forecasts, meanwhile, show midday dips in grid demand plunging deeper as the capacity of distributed solar installations approaches 13,500 MW by 2033.
1Nameplate capacity refers to the total amount of electricity a resource could produce running at 100% of its capability.
- Categories
- Inside ISO New England
- Tags
- solar, system operations
