Monthly wholesale electricity prices and demand in New England, September 2023

Wholesale power prices averaged $32.59 per megawatt-hour (MWh)1 in the Real-Time Energy Market in September 2023, down 47% compared to the previous year. Day-Ahead Energy Market averages were $30.28/MWh, down 55% from September 2022.
By the numbers
| September 2023 and Percent Change from September 2022 and August 2023 | September 2023 | September 2022 | August 2023 |
| Average Real-Time Electricity Price ($/megawatt-hour) | $32.59 | -46.9% | 13.1% |
| Average Natural Gas Price ($/MMBtu) | $1.60 | -76.4% | 14.3% |
| Peak Demand | 24,016 MW | 35.3% | 22.0% |
| Total Electricity Use | 9,677 GWh | 5.9% | -8.1% |
| Weather-Normalized Use2 | 8,871 GWh | -4.8% | -17.2% |
Drivers of wholesale electricity prices
In general, the two main drivers of wholesale electricity prices in New England are the cost of fuel used to produce electricity and consumer demand.
Power plant fuel
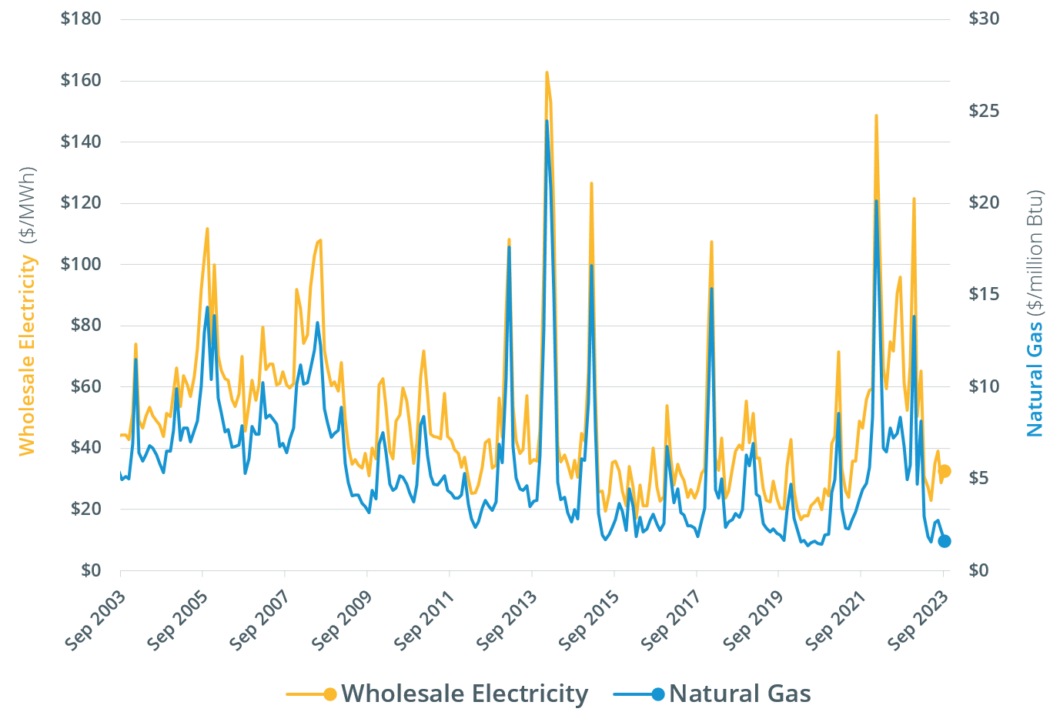
Fuel is typically one of the major input costs in producing electricity. Natural gas is the predominant fuel in New England, used to generate 52% of the power produced in 2022 by New England’s power plants, and natural gas-fired power plants usually set the price of wholesale electricity in the region. As a result, average wholesale electricity prices are closely linked to natural gas prices.
The average natural gas price during September was $1.60 per million British thermal units (MMBtu)3. The price was down 76% from the September 2022 average Massachusetts natural gas index price of $6.79/MMBtu. The Mass. index price is a volume-weighted average of trades at four natural gas delivery points in Massachusetts, including two Algonquin points, the Tennessee Gas Pipeline, and the Dracut Interconnect.
Wholesale electricity and natural gas prices, 2003-2023
Electricity demand
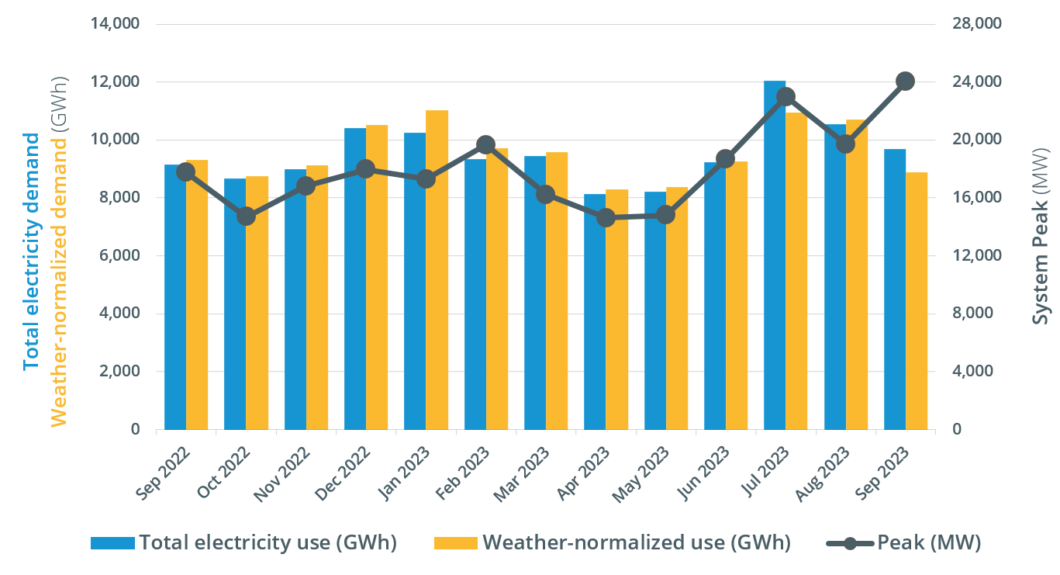
Demand is driven primarily by weather, as well as economic factors. Energy usage during September increased 5.9% to 9,677 GWh from the 9,140 GWh used in September 2022.
The average temperature during September was 66˚ Fahrenheit (F) in New England, up 2˚ from the previous September. The average dewpoint, a measure of humidity, was 58˚F in September, up 4˚ from the previous September. There were 74 cooling degree days4 (CDD) during September, while the normal number of CDD in September is 34 in New England. In September 2022, there were 22 CDD. There were 86 heating degree days (HDD) during September, while the normal number of HDD in September is 96 in New England. In September 2022, there were 87 HDD.
Consumer demand for electricity for the month peaked on September 7 during the hour from 5 to 6 p.m., when the temperature in New England was 88°F and the dewpoint was 70°. Demand reached 24,016 MW, marking the first time in decades that the year’s highest peak fell outside the months of June, July, or August. The September 2023 peak was 35.3% higher than the September 2022 peak of 17,749 MW, set during the hour from 5 to 6 p.m. on September 12, when the temperature was 76°F and the dewpoint was 66°.
Peak demand is driven by weather, which drives the use of heating and air conditioning equipment. The all-time high winter peak was 22,818 MW, recorded during a cold snap in January 2004 when the temperature was -1°F and the dewpoint was -20°. The all-time peak demand in New England was 28,130 MW, recorded during an August 2006 heat wave, when the temperature was 94°F and the dewpoint was 74°. Air conditioning use is far more widespread than electric heating in New England, so weather tends to have a relatively greater impact on the summer peak than the winter peak.
September monthly peak demand and total and weather-normalized energy use
Resource mix and emissions
The mix of resources used in any given time period depends on price and availability, as well as supplemental resource commitments needed to ensure system stability.
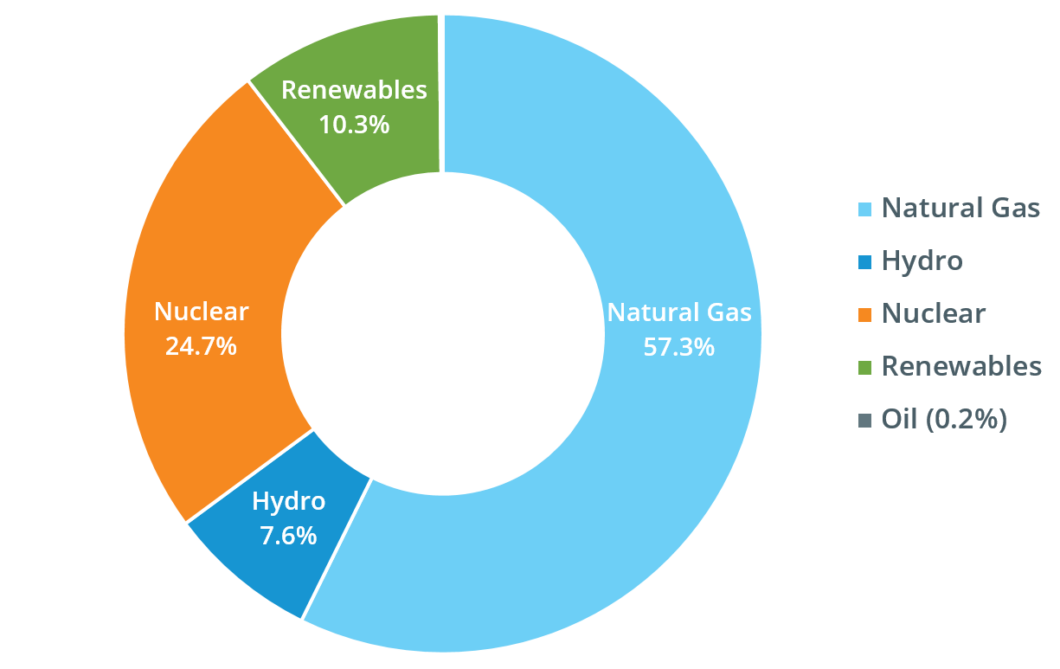
Natural gas-fired and nuclear generation produced about 82% of the 8,954 GWh of electric energy generated within New England during September, at about 57% and 25%, respectively. Renewable resources generated about 10% of the energy produced within New England, including 4.2% from wood, refuse, and landfill gas; 2.0% from wind; and 3.8% from solar resources. Hydroelectric resources generated 7.6%. Oil-fired resources generated 0.2%, and coal-fired resources did not produce a statistically significant amount of electricity.
The region also received net imports of about 859 GWh of electricity from neighboring regions.
September generation in New England, by source
The mix of resources used to produce the region’s electricity is a key driver of carbon dioxide (CO2) emissions. The ISO estimates these emissions through an analysis that blends data on electricity generation by fuel type with an emissions factor for each fuel that is based on data from the Environmental Protection Agency.5
September estimated CO2 emissions in New England, by fuel source (metric tons)
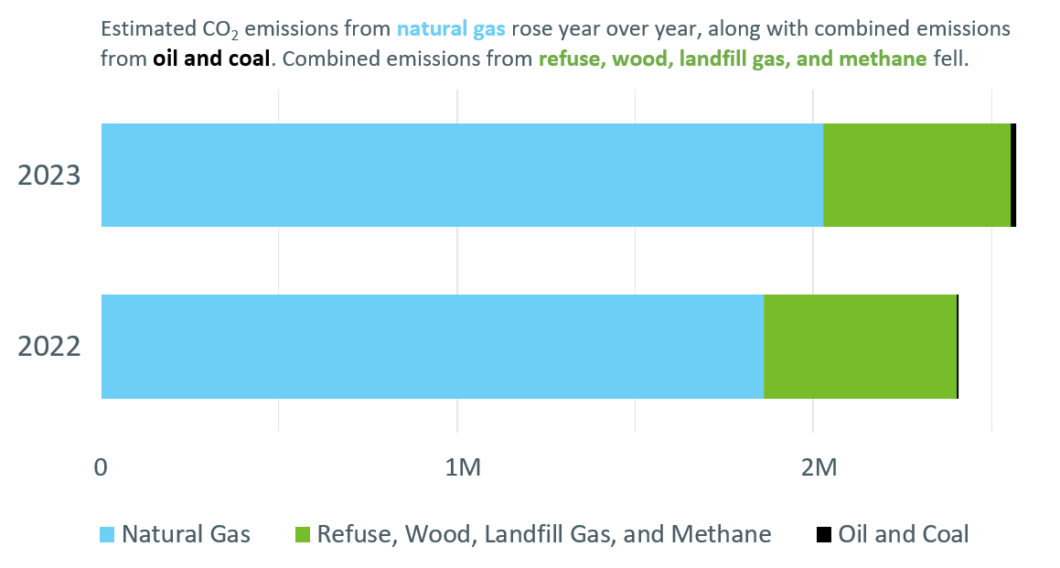
New England power plants produced an estimated 2.57 million metric tons of CO2 in September 2023, a 7% increase from last year.
Estimated CO2 emissions from natural gas-fired plants—typically the largest source of emissions, due to the significant amount of power these resources produce—rose 9% year over year, from 1.86 million metric tons to 2.03 million. These resources accounted for 79% of the power system’s estimated emissions.
Oil-fired resources produced an estimated 14,245 metric tons of CO2 (0.6% of the total), more than three times the amount they produced in September 2022. Coal-fired resources produced an estimated 170 metric tons of CO2—about half what they produced in September 2022, and 0.01% of the total.
CO2 emissions from other resources—mostly refuse and wood—were estimated at 527,903 metric tons, down 3% from last year. These resources accounted for about 21% of the power system’s estimated CO2 emissions for the month.
1One megawatt (MW) of electricity can serve about 750 to 1,000 average homes in New England. A megawatt-hour (MWh) of electricity can serve about 1,000 homes for one hour. One gigawatt-hour (GWh) can serve about 1 million homes for one hour.
2Weather-normalized demand indicates how much electricity would have been consumed if the weather had been the same as the average weather over the last 20 years.
3A British thermal unit (Btu) is used to describe the heat value of fuels, providing a uniform standard for comparing different fuels. One million British thermal units are shown as MMBtu.
4A degree day is a measure of heating or cooling. A zero degree day occurs when no heating or cooling is required; as temperatures drop, more heating days are recorded; when temperatures rise, more cooling days are recorded. The base point for measuring degree days is 65 degrees. Each degree of a day’s mean temperature that is above 65 degrees is counted as one cooling degree day, while each degree of a day’s mean temperature that is below 65 degrees is counted as one heating degree day. A day’s mean temperature of 90 degrees equals 25 cooling degree days, while a day’s mean temperature of 45 degrees equals 20 heating degree days.
5The factors used to calculate estimated CO2 emissions were updated in January 2023. ISO New England analysts regularly review and refine the methodology used to develop these emissions factors, in order to reflect the characteristics of New England’s generating fleet and improve the accuracy of the estimates.

Historical weather data provided by DTN, LLC.; Underlying natural gas data furnished by ICE.
- Categories
- Industry News & Developments
- Tags
- monthly prices, natural gas, wholesale markets