ISO-NE weather forecast improvements aid grid operations
When it’s hot—and increasingly when it’s cold—New Englanders turn to electricity to keep their homes just the right temperature. That makes weather the biggest factor determining how much electricity the region needs at any given time.
Weather forecasts that guide ISO New England’s hour-by-hour operation of the regional grid are already highly accurate, and the ISO is working to enhance this process further. Accurately forecasting consumer demand helps keep the electricity supply stable and energy pricing competitive.
ISO New England operators work around the clock to make sure the region has a sufficient supply of electricity, while also ensuring that too much energy isn’t generated and transmitted across the grid. Having more electricity on the transmission lines than is needed can damage equipment and threaten system reliability.
The region is divided into eight load zones with unique grid characteristics and wholesale electricity pricing. Weather conditions can vary between the load zones and even from one part of a load zone to another.
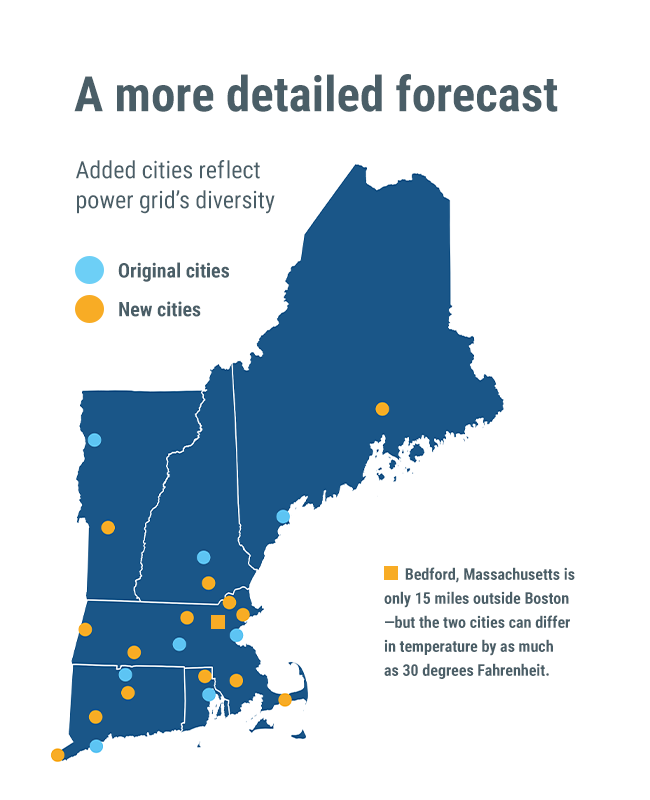
For years, ISO forecasters have been basing their weather models on information gathered hourly in eight cities, including in New England’s largest centers of electrical demand, Boston and Hartford. Soon the number of cities will grow to 23, better reflecting the variability in weather conditions across New England.
“The addition of 15 weather stations to our existing eight will enable our forecasting team and load forecast computer models to see and process smaller-scale weather features and changes impacting the various load zones,” said Michael Fontaine, the ISO’s Supervisor of Operations Forecasting. “The analysis and model outputs from this higher-resolution data will provide improved guidance resulting in an improved load forecast.”
The new data is based on information from National Weather Service stations and provided by third-party vendors. Using this information along with sophisticated computer models, historical weather data, and staff expertise, the ISO formulates a seven-day weather outlook to inform the load forecast, an estimation of future demand for electricity. These predictions also inform the ISO’s 21-Day Energy Assessment Forecast and Report.
One of the new weather stations is Bedford, Massachusetts. It’s only 15 miles outside Boston, but the two cities can differ in temperature by as much as 30 degrees Fahrenheit. The ISO also will gain insight into central and southeastern Massachusetts, as well as southwest Connecticut, interior Rhode Island, and elsewhere.
The scope of information gathered is expanding, as well. Until now, the data have covered temperature, dew point, wind speed, and cloud cover. Four new categories are being added: wet bulb temperature, wind direction, precipitation, and solar irradiance.
Wet bulb temperature is a measure of humidity that will complement dew point data and help the ISO refine predictions about when air conditioners will be working hardest and drawing the most electricity. Precipitation data can help forecasters anticipate increased demand related to everything from residential indoor lighting to municipal stormwater pumping stations.
- Categories
- Inside ISO New England
- Tags
- system operations, weather