ISO-NE adds features to popular mobile app
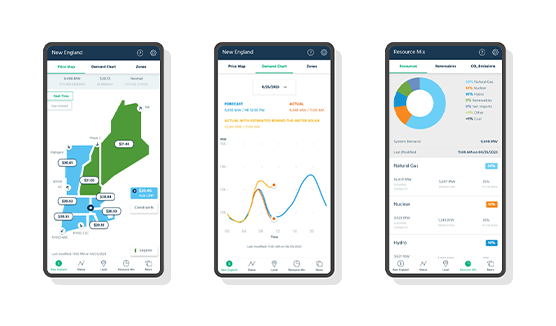
ISO New England has rolled out updates to ISO to Go, adding features from the ISO Express dashboard to the popular mobile app. Users can now view net imports, as well as estimates of behind-the-meter solar production and power system emissions.
“New England’s power system is constantly evolving, and ISO New England is always looking for new ways to share information,” said Michael Beganny, the ISO’s senior manager of digital platforms. “These enhancements provide ISO to Go users with even greater access to real-time information about the region’s grid.”
The new features are in addition to information app users have come to rely on regarding system conditions, energy market prices, and the resources providing energy to New England’s 15 million residents.
The updated ISO to Go is available for download in both the Apple and Android app stores.

Net imports
Added to ISO Express last summer, net import values represent the electricity imported from neighboring grids, less that being exported, providing a more complete look at how the region is meeting demand for grid electricity at any given moment.
Estimated behind-the-meter-solar
The vast majority of solar resources in New England, including residential rooftop arrays, are connected to local distribution systems or provide power directly to homes and businesses—not to the regional grid.
ISO to Go users can now see real-time estimates of the contributions of these resources, as well as the amount of electricity being supplied by the regional grid.
Estimated carbon dioxide emissions
ISO to Go users can now view estimated real-time carbon dioxide (CO2) emissions from New England’s power plants. The estimates are based on a formula that multiplies power generation, in megawatts (MW), from each fuel type by emissions factors developed by ISO New England and based on Environmental Protection Agency (EPA) data.
- Categories
- Inside ISO New England
- Tags
- environment, imports, solar
