Winter 2022/2023 recap: Wholesale prices drop during warm season marked by cold snaps

New England’s bulk power system operated reliably through the winter of 2022/2023, an abnormally warm season punctuated by brief but challenging cold-weather events.
Electricity consumption was below average for the winter as a whole and down about 4% from the previous winter. Although energy prices were elevated at the beginning of the season, they dropped significantly in the new year. The energy market value for December 2022 through February 2023 was down 29% compared to the winter of 2021/2022.
By the numbers
| Winter 2022-2023 | Winter 2021-2022 | Percent +/- | |
| Average Real-Time Electricity Price ($/megawatt-hour) | $79.53 | $105.48 | −25% |
| Average Natural Gas Price ($/MMBtu1) | $8.93 | $14.36 | −38% |
| Energy Market Value | $2.6 billion | $3.7 billion | −29% |
| Total Electricity Use | 29,958 GWh | 31,282 GWh | −4% |
Peak lower than last winter
Peak electricity demand for the winter of 2022/2023 came on February 3, reaching 19,645 megawatts (MW) in the hour between 6 and 7 p.m. when the average temperature in the region was 4°F. That’s lower than last winter’s peak of 19,756 MW, set on January 11, 2022, when temperatures averaged 10°F.
The peak was below the ISO’s forecasted peak under average weather conditions, 20,009 MW. Demand tends to be concentrated in the middle of the week and is lowest on weekends. Because this winter’s peak fell on a Friday, demand was relatively low despite the frigid temperatures.
New England saw its highest winter demand almost two decades ago during a cold snap in January 2004, when the peak was 22,818 MW. New England remains a summer-peaking system, meaning demand is highest during the summer, when high temperatures lead to increased use of air conditioners. The region’s all-time peak was set in August 2006 at 28,130 MW. As the New England states push to electrify the heating sector, however, the ISO projects the region will become a winter-peaking system in the mid-2030s.
The winter of 2022/2023 as a whole was almost 5°F warmer than normal, based on an eight-city weighted average. There were 35 consecutive days, including all of January, when the temperature was above normal.
The first month of 2023 proved to be the least energy-intensive January since the region’s wholesale electricity markets opened two decades ago, with an average load of 13,753 MW.
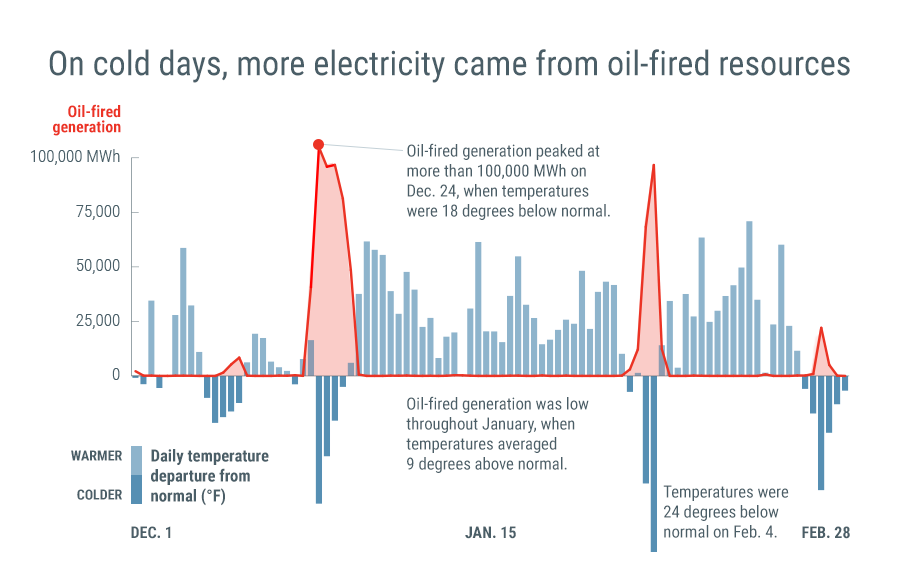
A tale of two cold snaps
The grid encountered its first challenge of the winter on December 24, when colder-than-forecasted temperatures settled in over the region, imported electricity was about 1,100 MW less than expected, and approximately 2,275 MW of resources scheduled to contribute power during the evening peak unexpectedly became unavailable. The average temperature for the day was about 13°F.
The ISO declared a capacity deficiency and implemented steps from a well-established operating procedure to manage operating reserve. Given the event’s relatively short duration and the ability of reserve resources to make up the deficiency, the ISO did not call for controlled outages or public conservation.
Resources that did not supply enough electricity or reserves to meet their capacity supply obligations were required to compensate the resources that made up the difference. Penalties totaled approximately $36 million. Charges for underperformance are paid by the underperforming resources, not electricity ratepayers.
The winter’s second, more intense cold snap on February 3 and 4 saw sub-zero temperatures throughout the region, with high winds in most areas resulting in wind chill values as low as 50° below zero. It was the region’s coldest weather since 2016.
While about 2,400 MW of generating capacity experienced unexpected outages at peak hours during this time, a larger proportion of resources made themselves available to meet demand. As much as 40% of contributing resources elected to start up on their own rather than being dispatched by ISO New England.
For the first time since 2016, New England exported electricity over its tie lines to Québec. New England typically imports energy from the Canadian province’s hydroelectric dams. But Québec experienced historically high demand for electricity during the cold snap, and on the morning of February 4 it purchased supply from New England (about 1,000 MW) as well as New York and Ontario.
While New England had energy to spare, the cold snap presented another challenge for the ISO’s load forecasts. Temperatures again were colder than forecast models predicted, and the cold led to increased electricity demand.
The shift to hybrid work in the wake of the COVID-19 pandemic has noticeably changed the way electricity is consumed, both in New England and around the world. While the forecast models the ISO relies on have access to decades worth of weather data, they lacked sufficient information on how extremely cold weather would affect demand in the post-COVID world. The ISO expects load forecasts to improve now that data from the December and February cold snaps has been incorporated into its computer models.
Wholesale electricity prices
The winter energy market value decreased year over year, from $3.7 billion in the winter of 2021/2022 to $2.6 billion in the winter of 2022/2023.
That drop was in line with a 38% decline in the price of natural gas, from $14.36 per million British thermal units last winter to $8.93 this winter. Natural gas is the predominant energy fuel in New England, accounting for 52% of the electricity produced by the region’s power plants in 2022.
The Real-Time Energy Market saw significant price spikes during the cold snaps when demand surged along with the price on natural gas. On the flipside, negative real-time prices resulted on various days when low demand and low natural gas prices occurred.
Real-time prices averaged more than $2,000 per megawatt-hour (MWh) during the 2.5-hour capacity deficiency on December 24. Similarly, real-time prices approached $500 on February 4, when the average temperature was below 3°F, and $400 on February 25, when the average temperature was about 16°F.
While high, these prices were unlikely to affect most consumers given the fact that retail rates are set months in advance. Further, almost all of New England’s wholesale electricity is bought and sold in the Day-Ahead Energy Market, minimizing the effects of real-time price swings.
In contrast, real-time prices dipped to almost −$100 on February 20, when the average temperature climbed as high as 58°F and electricity demand was lower than forecasted. Negative prices may become more common with the proliferation of solar resources, and could create incentives for broader adoption of energy storage technologies.
For the winter as a whole, real-time prices averaged $79.53. That’s down almost one-quarter from $105.48 for the winter of 2021/2022. Day-ahead prices averaged $78.29, down 29% from last winter.
Fuel mix and emissions
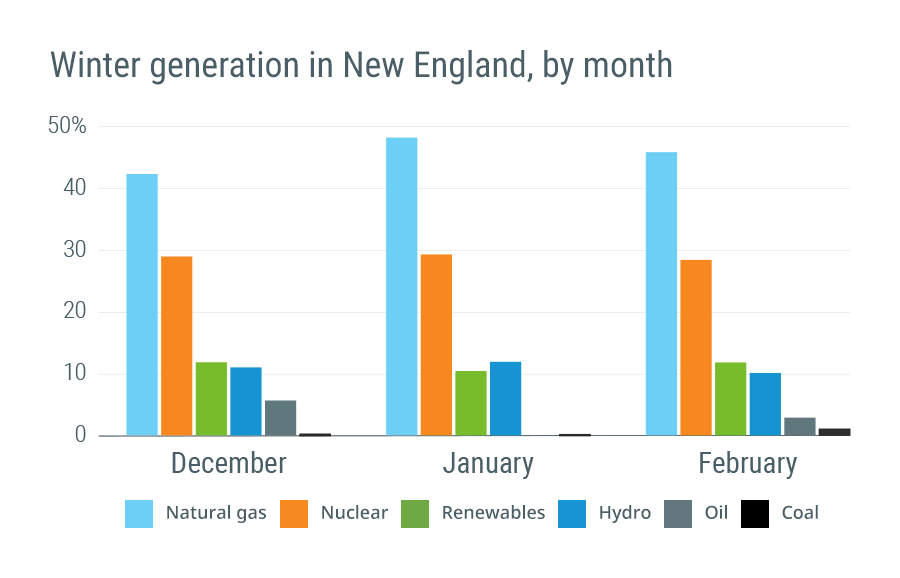
Natural gas remained the region’s predominant energy fuel this winter, accounting for 11,243 GWh or 45% of electricity consumed. But during the December and February cold snaps, high spot prices for natural gas led to oil temporarily taking the lead. Approximately 13.5 million gallons of oil was used to generate about 165 GWh of electricity February 3 and 4.
Oil-fired generation accounted for 3% of all the electricity produced within New England this winter. Just under 50 million gallons of oil yielded 712 GWh. That’s less than the 80 million gallons of oil used last winter, when oil represented 5% of generation. During the winter of 2017/2018, an otherwise mild winter interrupted by two weeks of extreme cold, power plants used approximately 100 million gallons of oil.
Nuclear power plants produced 29% of the region’s electricity this winter. Coal’s share decreased from 1% last winter to 0.6% this winter.
Hydroelectric resources accounted for 11% of the region’s generation this winter, compared to 7% last winter. Production from grid-connected solar resources saw a slight increase, accounting for 2% of the region’s generation. Wind was roughly the same from winter to winter at 4%.
New England received net imports of about 6,300 GWh of electricity from neighboring regions from December through February, down from roughly 6,700 GWh the previous winter.
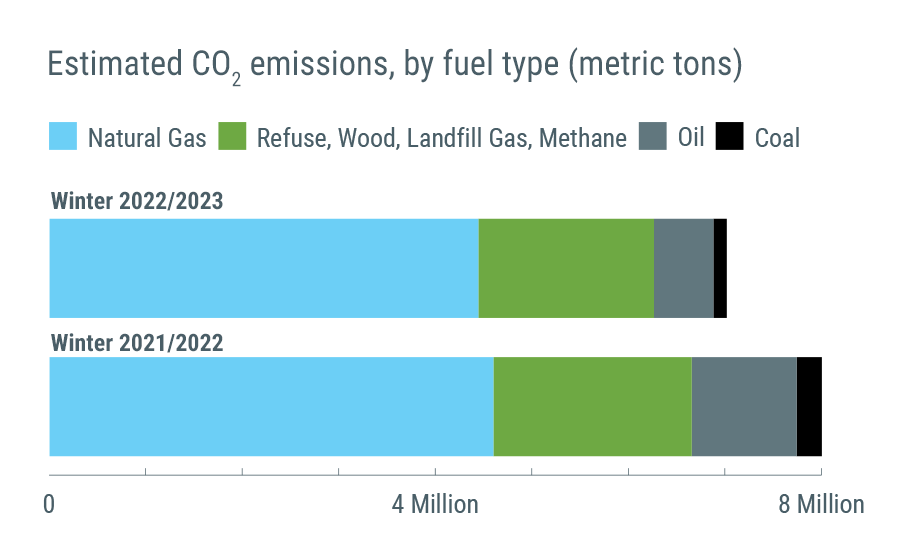
The mix of resources used to produce the region’s electricity is a key driver of carbon dioxide (CO2) emissions. The ISO estimates these emissions through an analysis that blends data on electricity generation by fuel type with an emissions factor for each fuel that is based on data from the Environmental Protection Agency.2
From December through February, CO2 emissions from New England power plants were down about 12% from the previous winter, falling from an estimated 8 million metric tons to just over 7 million metric tons. The drop was due in part to lower demand this winter, and to lower production from oil-fired resources, which produce more CO2 per megawatt-hour of electricity generated than power plants fueled by natural gas.
Oil-fired generators produced about 615,500 metric tons of CO2 this winter, a drop of about 43% from last winter’s total of more than 1 million metric tons. Emissions from natural-gas-fired plants fell about 3%, from 4.6 million metric tons to 4.4 million. CO2 emissions from refuse, wood, landfill gas, and methane fell about 11%, from just over 2 million metric tons last year to 1.8 million metric tons this winter. Estimated emissions from coal-fired plants fell by 47%, from around 260,000 metric tons to about 138,800.
1. A British thermal unit (Btu) is used to describe the heat value of fuels, providing a uniform standard for comparing different fuels. One million British thermal units are shown as MMBtu.
2. The factors used to calculate estimated CO2 emissions were updated in January 2023. ISO New England analysts regularly review and refine the methodology used to develop these emissions factors, in order to reflect the characteristics of New England’s generating fleet and improve the accuracy of the estimates.
- Categories
- Inside ISO New England
- Tags
- system operations, weather, wholesale markets, wholesale prices, winter