Solar power’s impact on grid seen in record number of ‘duck curve’ days

On a sunny, mild Sunday afternoon last spring, demand for electricity from the region’s power grid fell to the lowest level ever seen by ISO New England’s system operators.
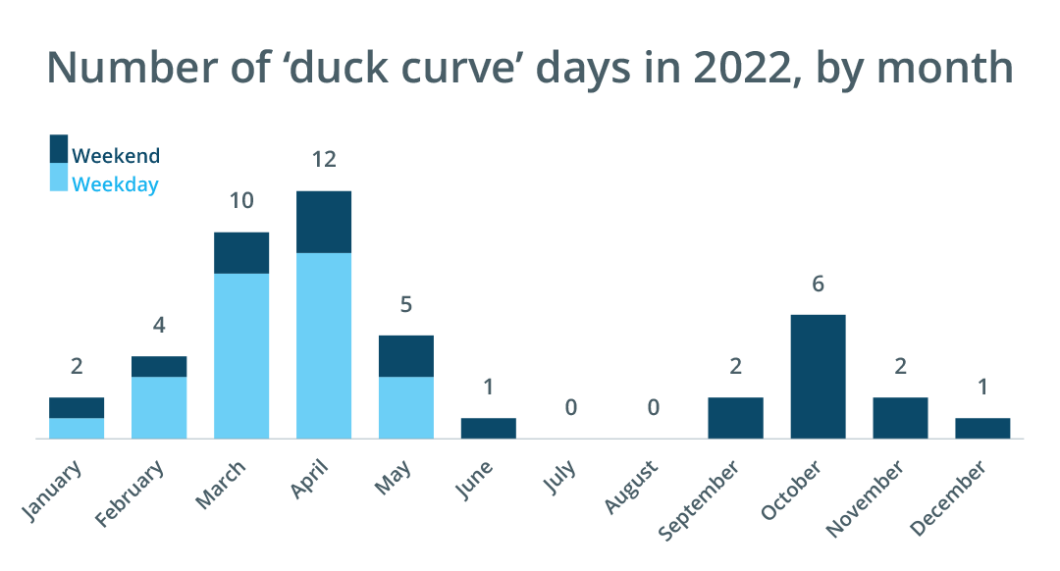
May 1 was a day for the record books, but it was also one of 45 times in 2022 when demand for grid electricity was lowest during the day instead of at night. These “duck curve” days—when a line chart representing grid demand resembles the silhouette of a duck—occur when behind-the-meter photovoltaic (BTM PV) installations significantly reduce the amount of electricity homes and businesses draw from the grid. This means less generation is needed from grid-connected resources, including power plants that run on natural gas, oil, and coal. The ISO first observed the phenomenon on April 21, 2018, and it happened 34 more times through the end of 2021.
The fact that the 2022 count exceeded the total for the previous four years combined points to the growing contribution of BTM PV to New England’s energy mix—particularly in the spring, when solar production is at its strongest. The ISO estimates that on May 1, 2022, BTM PV supplied more than 4,000 megawatts (MW) of electricity during the afternoon hours, as demand for electricity from the grid dropped below 7,600 MW.

The first duck curve day in 2022 occurred on January 16, and the last was on December 25. Daytime demand minimums were recorded at least once each month except for July and August, when the use of air conditioning typically pushes demand to the highest levels of the year and summer heat reduces the efficiency of solar panels. Duck curves also occurred on each day of the week, with just over half recorded on weekdays.
There have already been a half-dozen duck curve days in 2023, with the first falling on January 8.
Curves of the future
Understanding the interplay between BTM PV and the grid is crucial to the reliable planning and operation of the bulk power system.
The ISO incorporated enhanced modeling for BTM PV into its daily operational forecasts in 2019. Refinements to these operational forecasts continue, and the ISO has expanded the capabilities of its BTM PV forecasting tools by incorporating data from additional vendors. Forecasters blend these data sources to produce a more accurate estimate of how much electricity BTM PV will produce throughout a given day.
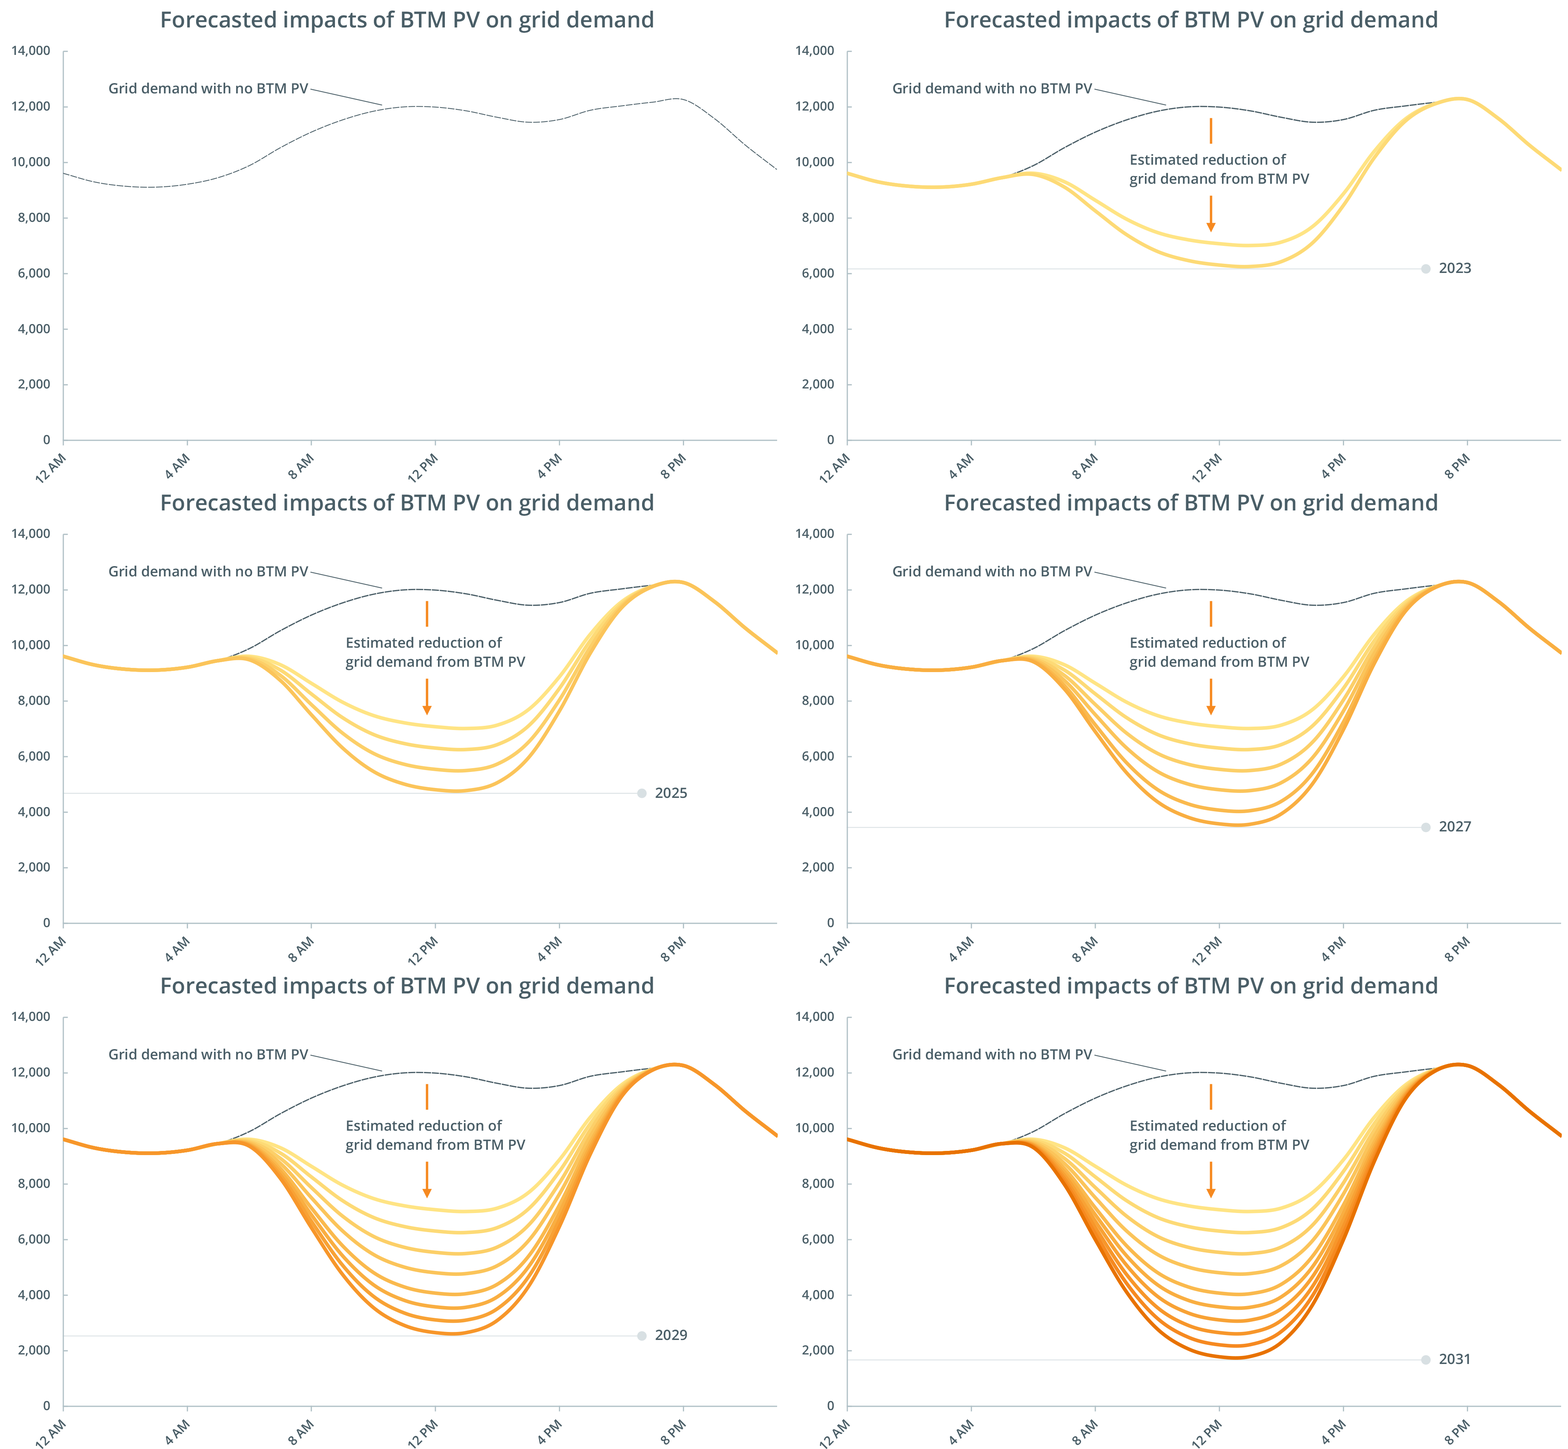
The ISO’s long-term forecasts, meanwhile, show midday dips in grid demand plunging deeper as BTM PV increases over the next decade.
Using data from May 1, 2022, ISO analysts modeled the potential impacts of BTM PV through 2031. The animated chart below shows year-by-year projections for how BTM PV would have reduced grid demand, holding other variables constant (for example, it does not include forecasts for annual growth in demand).

In 2021, the region’s total nameplate PV capacity was about 4,800 MW.1 According to the most recent 10-year forecast for solar production, that figure is expected to rise to 11,500 MW by 2031—and the majority of the capacity will be behind-the-meter.
The patterns revealed in these forecasts suggest how the power system’s needs will evolve in the years ahead. While BTM PV has the potential to satisfy a significant share of consumer demand when conditions are right, other resources must be available to balance supply and demand when clouds roll in, as daylight fades, or when snow covers a significant share of PV panels.
1Nameplate capacity refers to the total amount of electricity a resource could produce running at 100% of its capability.
- Categories
- Features & Interviews
- Tags
- clean energy, solar
