ISO-NE rolls out enhancements to report on 21-day energy supply forecast
This article was updated in June 2025 to reflect further enhancements to the report.
ISO New England this month launched a new format for its 21-Day Energy Assessment Forecast and Report, a rolling, three-week outlook of anticipated power system conditions.
The assessment examines whether the region’s electricity supply could fall below forecasted consumer demand and required operating reserves during any hour in the upcoming three-week period. The updates to the report for winter 2022-2023 include new graphics designed to offer at-a-glance summaries of system conditions and the variables used in the forecast.
The first page provides an overview of the assessment:
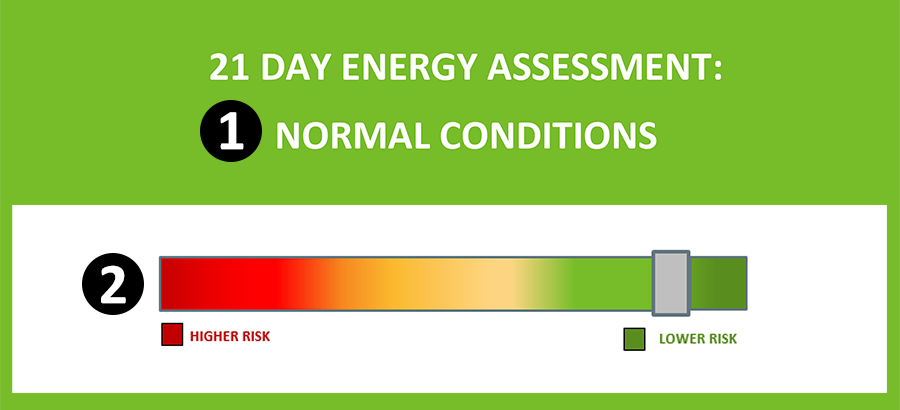
1. Text will list either Normal Conditions, Energy Alert, or Energy Emergency, based on thresholds for the anticipated hourly energy surplus or energy deficit during the forecast period.
2. A graphic indicates the power system’s general risk level, based on variables that include demand, weather, expected generator outages, and fuel supplies.
Page 2 provides more detail about the weighted variables that determine the system’s risk level:
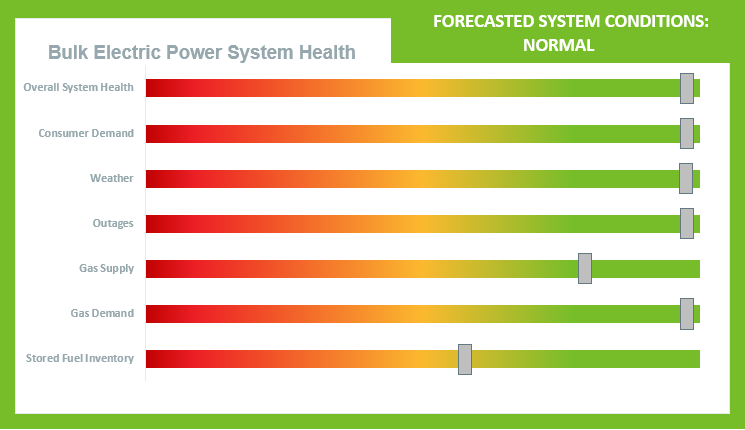
- Overall System Health represents the energy surplus in New England over the 21-day period. The indicator moves from green to red as the hourly surplus drops, with thresholds of 8,000 megawatts (MW), 3,500 MW, and 2,100 MW.
- Consumer Demand represents hourly system load. The indicator moves from green to red as forecasted demand increases, with thresholds of 20,000 MW, 24,000 MW, and 26,000 MW.
- Weather represents the total number of degree deviations from 40⁰F and 80⁰F over the 21-day period. The slider reflects the cumulative deviation below 40⁰F (winter) or above 80⁰F (summer).
- Outages refers to the amount of generation expected to be unavailable during the forecast period.
- Pipeline Natural Gas Supply represents the availability of natural gas to New England, using pipeline capacity restrictions to identify the total gas available. The slider position represents the total volume of gas over the 21-day period.
- Pipeline Natural Gas Demand represents natural gas availability to generators, taking local distribution company demand across the 21-day period into consideration. It is based on the forecasted total natural gas usage in billion cubic feet (Bcf), with anything less than 40 bcf not moving the slider.
- Stored Fuel Inventory reflects the total usable fuel inventory in New England. the position of the slider is in relation to 70% full, and reflects current regional capacity based on weekly generator surveys.
Page 3 lists more detailed information about any Energy Alerts or Energy Emergencies:
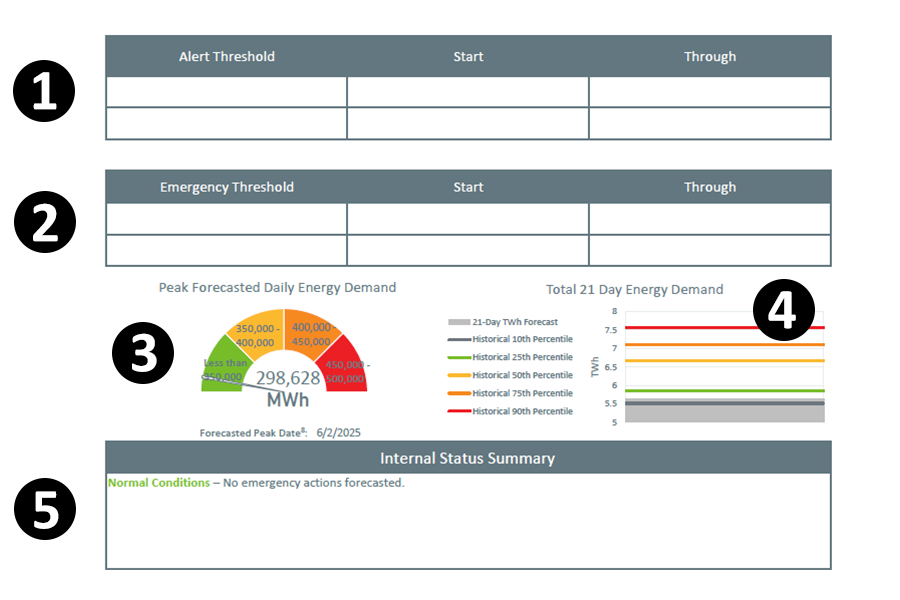
Energy Alerts and Energy Emergencies are used to forecast potential energy shortfalls in the upcoming three weeks, and indicate that the ISO expects to use emergency actions to support grid reliability.
1. Energy Alerts are issued for anticipated energy shortfalls in days six to 21 of the forecast period. The table indicates when an Energy Alert is expected to begin and end, as well as the forecast alert level.
2. Energy Emergencies are issued for a forecast alert in days one to five, or when controlled power outages are forecasted within the 21-day period.
3. The “gauge” graphic shows the forecasted peak daily energy demand during the assessment period, including the date the peak is expected to occur.
4. The Total 21 Day Energy Demand graphic shows the forecast for the region’s total demand for electricity over the 21 days (light gray). The horizontal reference lines show how the forecast for the current period compares to historical data.
5. When warranted, the Status Summary field will include information about anticipated system operating conditions during the forecast period.
Other report highlights
Charts on pages 4 and 5 show exactly when system conditions warranting an Energy Alert or Energy Emergency are forecast.
On these charts—one for the full 21 days, and one for five days—a black line tracks the anticipated hourly energy surplus or energy deficit. As shown in this example from the report published on December 7, 2022, the line is not visible unless the forecasted energy surplus falls below 5,000 MW in one or more hours:
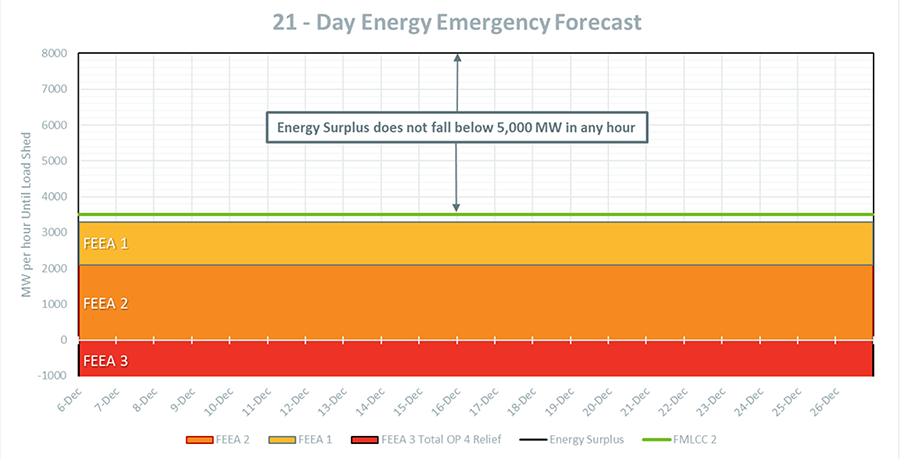
The chart includes color-coded regions corresponding to the energy supply thresholds that trigger an alert or emergency.
The report’s additional charts and tables provide more information about the variables and data used in the assessment, such as:
- Forecasted temperatures and consumer demand for each hour of the 21-day period
- A forecast for how quickly generating capacity for oil-fired resources will fall as they deplete their fuel supplies
- A chart showing the history of aggregated oil inventories at generators in New England for both distillate fuel oil and residual fuel oil
- A table indicating the total oil burned since the last generator survey
The ISO publishes the report to its website every Wednesday morning during the winter, when concern about energy adequacy is highest, and once every two weeks for the rest of the year. When enhanced situational awareness would be required, such as during an Energy Alert or Energy Emergency, the ISO would publish the report more frequently.
- Categories
- Features & Interviews
- Tags
- forecast, system operations, weather, winter