Summer 2022 recap: Grid reliability maintained through heat waves, rising gas prices

Despite two extended heat waves, New England’s electricity grid operated reliably during the summer of 2022.
Meanwhile, disruptions in the global energy markets continued to drive local wholesale electricity prices higher, with the average price of natural gas more than doubling from the same period last year.
Heat waves push demand
Demand for electricity in summer 2022 was nearly 37,000 gigawatt-hours (GWh), up 2% from summer 2021.
Heat waves hit the region in July and August. At six days each, the heat waves were more remarkable for their duration than their temperatures. The ISO’s eight-city weighted average showed a high temperature of 94 degrees Fahrenheit for each heat wave, on July 24 and August 7. Humidity stayed relatively low during both waves, keeping heat indexes below 100 degrees.
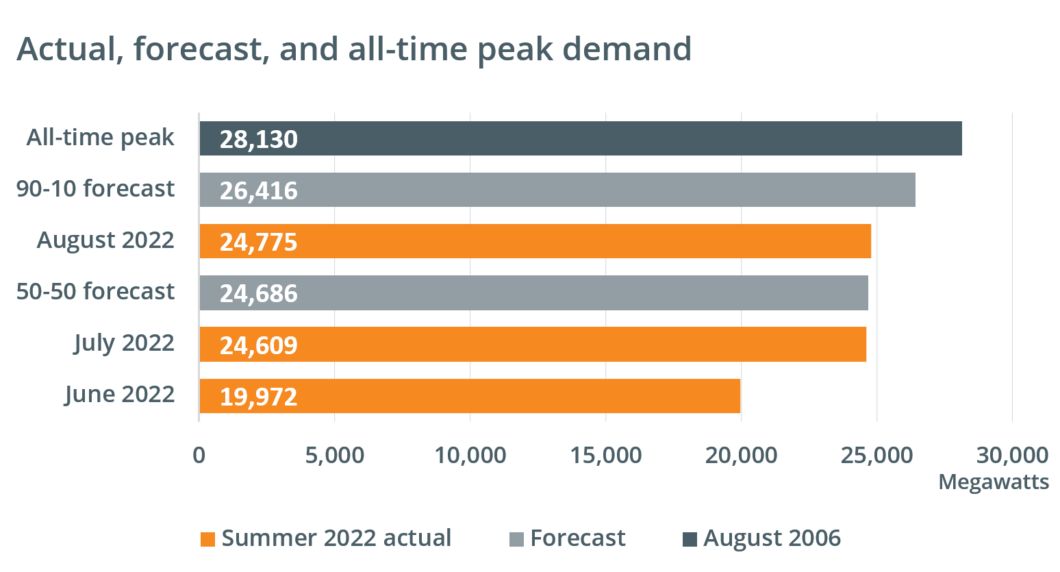
The first heat wave saw electricity use peak at 24,609 megawatts (MW) on July 20. The peak was slightly higher in the second heat wave, at 24,775 MW on August 4. Both peaks were close to the ISO’s 50-50 summer load forecast, representing average conditions, of 24,686 MW.1
Behind-the-meter photovoltaic (BTM PV) contributions—which reached a high of 4,000 MW on July 19—were concentrated at midday and were significantly lower at peak demand hours in the evening. Without contributions from BTM PV, demand for grid electricity would have approached the ISO’s 90-10 load forecast, representing above-average heat and humidity, of 26,416 MW.
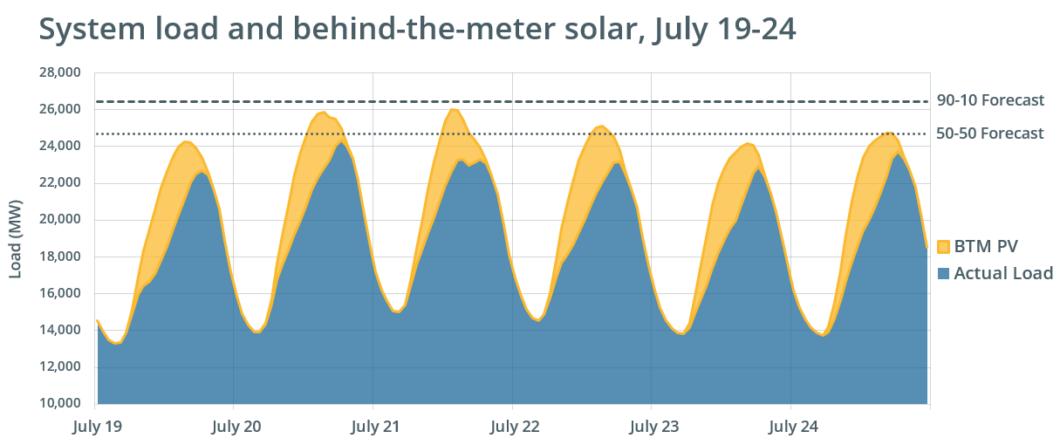
The ISO issued Master/Local Control Center 2 (M/LCC 2) abnormal system conditions alerts during both heat waves—from July 19-24 and on August 4 and 8. The alerts advise generators and transmission companies to take appropriate action to postpone any maintenance or testing that could take additional systems offline and jeopardize the reliability of the grid. The alerts were issued as a precaution, and there were no energy shortages or the need for other procedures during either heat wave.
Some unplanned resource outages and reductions occurred during the July heat wave, averaging about 1,500 MW each day. The majority of the outages were due to heat-related mechanical issues; some resources saw reduced output due to high ambient temperatures. During the August heat wave, unplanned resource outages averaged about 750 MW each day.
June’s weather was mild compared to the other two summer months, with demand peaking at 19,972 MW. In a measure of the reduced demand for air conditioning, there were 22 cooling degree days (CDD) during June, while the normal number of CDD in June in New England is 48.2 There were an above-average 146 cooling degree days in July and 156 in August.
Cost of natural gas pushes wholesale electricity prices
Real-time wholesale electricity prices averaged $86.28 per megawatt-hour in summer 2022, up 114% from 2021.
The average natural gas price for summer 2022 was $7.70 per million British thermal units (MMBtu).3 It was an increase of 131% from summer 2021. The year-over-year increase in the price of natural gas in summer 2022 made electricity generation more expensive, driving the price increases in the wholesale electricity markets. Natural gas prices are up globally, due in part to the Russian invasion of Ukraine.
The average real-time wholesale electricity price in summer 2022 was higher than any summer of the previous five years. Wholesale electricity prices have climbed in New England after a record low average of $22.50 for the months of June through August 2020, when natural gas prices dropped during the early months of the coronavirus pandemic, leading to lower prices in the energy markets.
Fuel mix and emissions
Natural gas is the predominant fuel for the production of electricity in New England, and it accounted for over 60% of the region’s generation in both July and August.
Approximately 6 million gallons of fuel oil were used during the July heat wave as a result of unplanned outages of natural gas generating facilities. With fewer natural gas resources being out of service during the August heat wave, only about 1.5 million gallons of fuel oil were used during that period.
Oil-fired generation accounted for more than 11% of the electricity produced within New England during some afternoon and evening hours in the July heat wave. Across the month of July, though, oil-fired generation accounted for just 0.7% of the electricity produced within New England. In August that figure fell to 0.2%.
The heat waves also had implications for regional power system carbon dioxide (CO2) emissions.
Coupled with the overall increase in demand for electricity, shifts in the resource mix can drive up regional air emissions, as oil-fired resources produce more CO2 per megawatt-hour of electricity generated than any other fuel. The ISO estimates these emissions through an analysis that blends data on electricity generation by fuel type with an emissions factor for each fuel that is based on data from the Environmental Protection Agency.
At an estimated 845,967 metric tons, CO2 emissions from New England power plants during the July heat wave were about 50% higher than the same week in 2021.
For the entire month of July, emissions increased about 17% year over year. While emissions spiked during the July heat wave due to oil-fired generation, the increase across the month was driven by higher demand and an associated increase in gas-fired generation to meet it.
Emissions were flat in August 2022 compared to August 2021, as the region saw only a slight year-over-year increase in electricity use.
The summer of 2022 was also marked by below-normal precipitation, with much of New England experiencing abnormally dry or drought conditions. The lack of rainfall did not have an appreciable effect on hydropower output. In fact, hydropower resources were among those ramping up production at times of peak demand during July’s heat wave.
1 The 50-50 forecast is for electricity demand during average weather, and means that there is a 50 percent chance peak demand will be above or below the forecast. The 90-10 forecast—which reflects above average heat and humidity in the summer, and colder than average temperatures in the winter—means there is a 10 percent chance that peak demand will be higher than the forecast.
2 A degree day is a measure of heating or cooling. A zero degree day occurs when no heating or cooling is required. As temperatures drop, more heating days are recorded; when temperatures rise, more cooling days are recorded. The base point for measuring degree days is 65 degrees. Each degree of a day’s mean temperature that is above 65 degrees is counted as one cooling degree day, while each degree of a day’s mean temperature that is below 65 degrees is counted as one heating degree day. A day’s mean temperature of 90 degrees equals 25 cooling degree days, while a day’s mean temperature of 45 degrees equals 20 heating degree days.
3 A British thermal unit (Btu) is used to describe the heat value of fuels, providing a uniform standard for comparing different fuels. One million British thermal units are shown as MMBtu.
- Categories
- Inside ISO New England
- Tags
- natural gas, summer, system operations, wholesale prices