ISO-NE adds net imports to renamed resource mix chart, graph on ISO Express

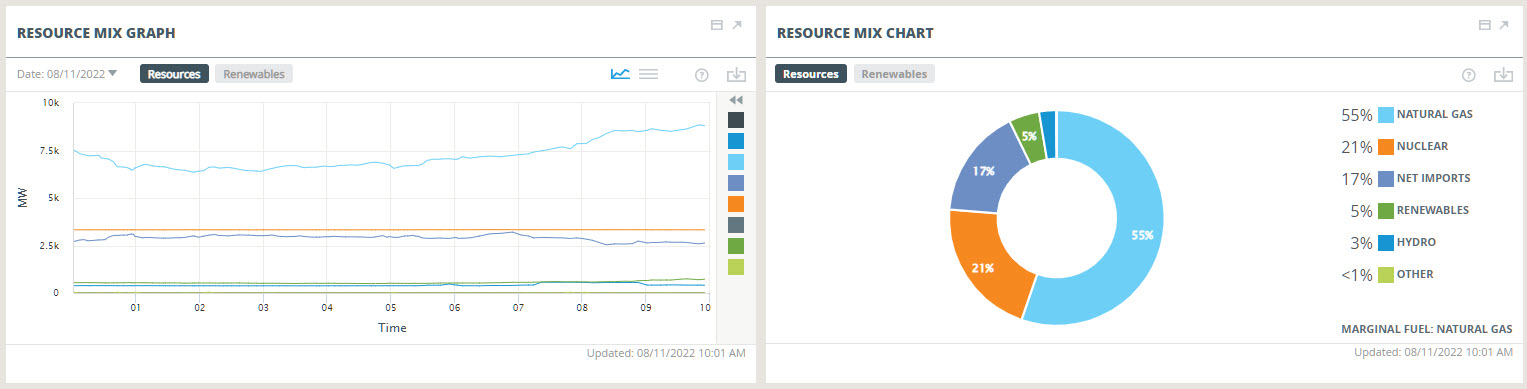
ISO New England has added net imports to the fuel mix chart and graph on ISO Express—and to the chart on the iso-ne.com homepage—making it easier to see how the region is meeting demand for grid electricity at any given moment.
Net import values represent the electricity imported across the region’s tie lines to neighboring grids, less that being exported. Both the chart and graph have been renamed “Resource Mix” to better reflect the information being shown.
As had previously been the case, the Resource Mix graph shows the level of production, in megawatts, from different resource types throughout the course of a day, while the chart shows, as percentages, how these resource types are contributing at a given moment.
ISO New England is planning to make similar changes to how resource types are displayed on the ISO to Go mobile app in the coming months.
The addition of net imports to the resource mix graphics follows a number of other updates ISO New England has made to the ISO Express dashboard in recent months to provide an enhanced real-time view of the region’s power system.
Read more:
- Categories
- Inside ISO New England
- Tags
- imports, resource mix