Monthly wholesale electricity prices and demand in New England, January 2022
Colder weather, higher demand, and spiking natural gas prices converged in January to push wholesale electricity prices to their highest levels since February 2014.
Power prices in the Real-Time and Day-Ahead energy markets more than tripled compared to January 2021 as the average price of natural gas quadrupled, rising above $20 per million British thermal units (MMBtu) for the first time in eight years. Real-time prices were up 240%, averaging $148.66 per megawatt-hour (MWh). The average day-ahead price rose to $149.46/MWh, up 250% from January 2021.
These factors—along with a 5.6% increase in power demand—produced the second-highest energy market value of any January during the nearly two decades the wholesale markets have operated in their current form. The $1.8 billion in energy transactions recorded in January 2022 were only surpassed by the $2.2 billion market value of January 2014.
High natural gas prices also drove a significant shift in the mix of fuels used to produce the region’s electricity, which in turn led to an increase in estimated carbon dioxide (CO2) emissions. Oil-fired generators were dispatched more frequently during stretches of cold weather as natural-gas-fired generators became more expensive to run. As a result, oil-fired generators produced 4.5 times more electricity in January 2022 than they produced in all of 2021.
Due to the increase in generation from higher-emitting oil-fired plants—and the drop in the share of generation from lower-emitting, highly-efficient natural-gas-fired plants—CO2 emissions in January 2022 were up an estimated 51% compared to January 2021.
By the numbers
| January 2022 and Percent Change from January 2021 and December 2021 | January 2022 | January 2021 | December 2021 |
| Average Real-Time Electricity Price ($/megawatt-hour*) | $148.66 | 239.8% | 150.2% |
| Average Natural Gas Price ($/MMBtu**) | $20.12 | 304.8% | 140.1% |
| Peak Demand | 19,729 MWs | 4.7% | 10.0% |
| Total Electricity Use | 11,279 GWh | 5.6% | 9.5% |
| Weather-Normalized Use*** | 11,119 GWh | 1.6% | 6.2% |
Other January highlights:
Since the implementation of the current market design in March 2003, January 2022 ranks as the:
- Third-highest monthly average real-time energy price (per MWh); the highest was $162.88/MWh in January 2014.
- Second-highest January energy market value:
- January 2014: $2.190 billion
- January 2022: $1.789 billion
- January 2018: $1.340 billion
- January 2008: $1.096 billion
- January 2013: $1.085 billion
- Third-highest monthly average natural gas price:
- January 2014: $24.50
- February 2014: $20.85
- January 2022: $20.12
- February 2013: $17.63
- February 2015: $16.61
- Highest total Real-Time Energy Market obligation for demand-response resources****—13 GWh—of any month since price-responsive demand was implemented in June 2018. The next highest total was 5.4 GWh in July 2019.
Drivers of wholesale electricity prices
In general, the two main drivers of wholesale electricity prices in New England are the cost of fuel used to produce electricity and consumer demand.
Power plant fuel
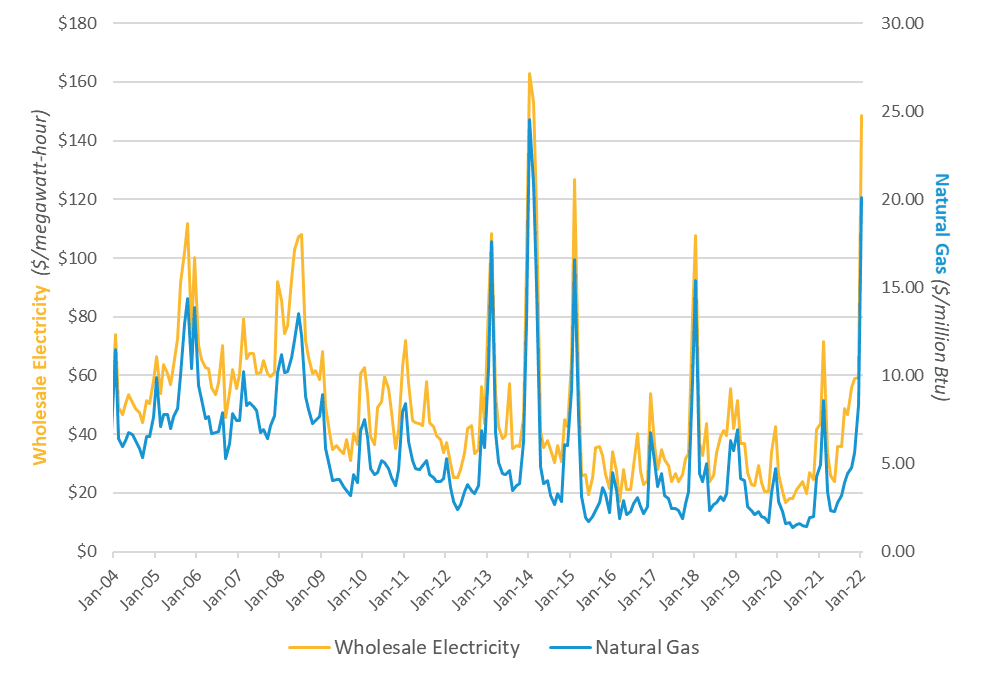
Fuel is typically one of the major input costs in producing electricity. Natural gas is the predominant fuel in New England, used to generate 53% of the power produced in 2021 by New England’s power plants, and natural gas-fired power plants usually set the price of wholesale electricity in the region. As a result, average wholesale electricity prices are closely linked to natural gas prices.
The average natural gas price during January was $20.12/MMBtu. The price was up 305% from the January 2021 average Massachusetts natural gas index price of $4.97/MMBtu. The Mass. index price is a volume-weighted average of trades at four natural gas delivery points in Massachusetts, including two Algonquin points, the Tennessee Gas Pipeline, and the Dracut Interconnect.
January wholesale electricity and natural gas prices
Electricity demand
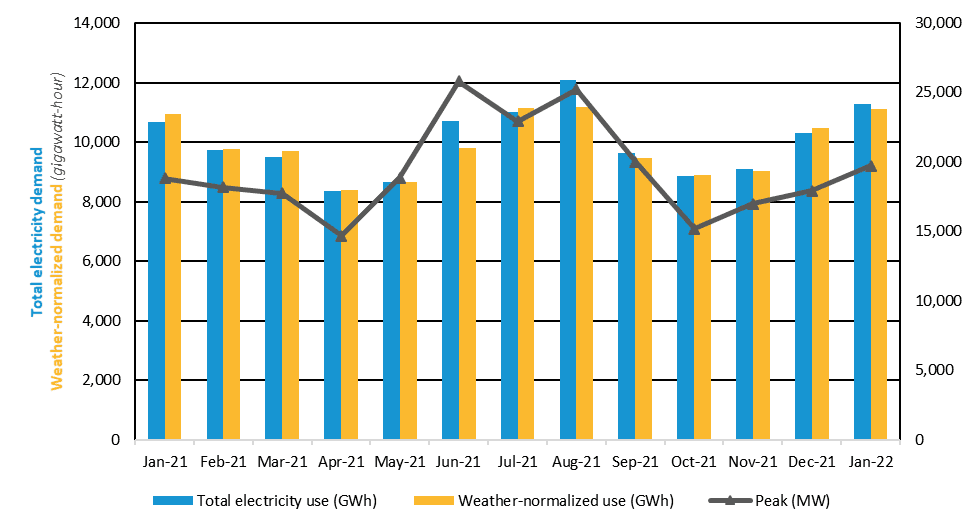
Demand is driven primarily by weather, as well as economic factors. Energy usage during January increased 5.6% to 11,279 GWh from the 10,679 GWh used in January 2021. The average temperature during November was 25˚ Fahrenheit (F) in New England, down 4˚ from the previous January. The average dewpoint, a measure of humidity, was 13˚F in January, down 5˚ from the previous January. There were 1,246 heating degree days (HDD)***** during January, while the normal number of HDD in January is 1,189 in New England. In January 2021, there were 1,111 HDD. There were no cooling degree days in January. ISO New England published weekly reports on the estimated impact on electricity demand of societal changes in response to the COVID-19 pandemic through the end of February 2022.
Consumer demand for electricity for the month peaked on January 11 during the hour from 5 to 6 p.m., when the temperature in New England was 10°F and the dewpoint was -11°. Demand reached 19,729 MW. The January 2022 peak was 4.7% higher than the January 2021 peak of 18,839 MW, set during the hour from 5 to 6 p.m. on January 29, when the temperature was 16°F and the dewpoint was -1°.
Peak demand is driven by weather, which drives the use of heating and air conditioning equipment. The all-time high winter peak was 22,818 MW, recorded during a cold snap in January 2004 when the temperature was -1°F and the dewpoint was -20°. The all-time peak demand in New England was 28,130 MW, recorded during an August 2006 heat wave, when the temperature was 94°F and the dewpoint was 74°. Air conditioning use is far more widespread than electric heating in New England, so weather tends to have a relatively greater impact on the summer peak than the winter peak.
January monthly peak demand and total and weather-normalized energy use
Fuel mix and emissions
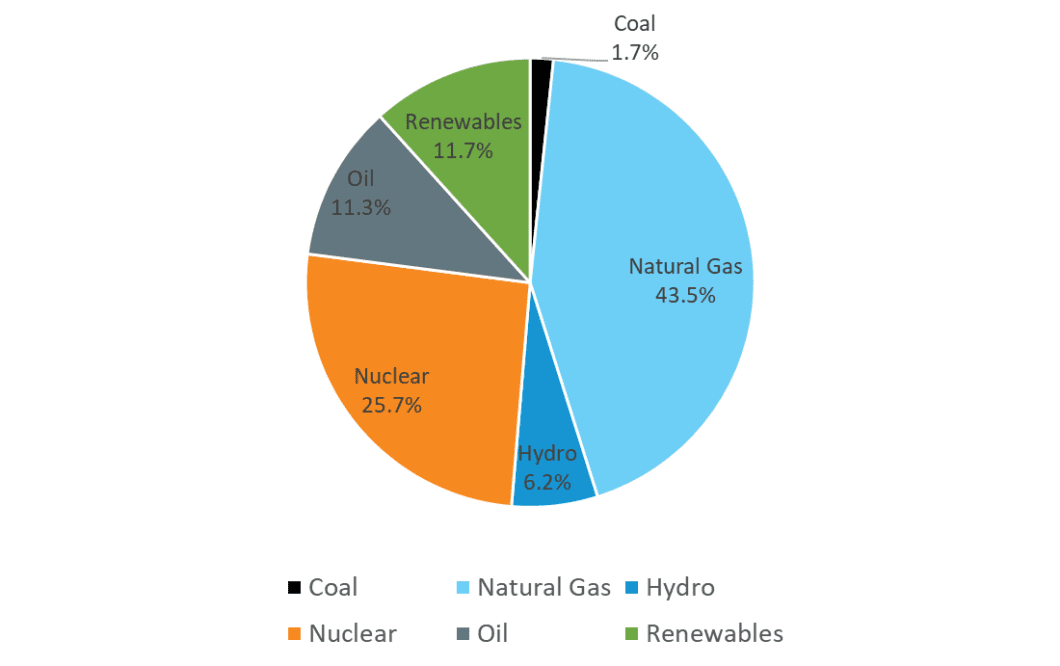
The mix of resources used in any given time period depends on price and availability, as well as supplemental resource commitments needed to ensure system stability. Natural gas-fired and nuclear generation produced about 69% of the 9,141 GWh of electric energy generated within New England during January, at about 43% and 26%, respectively. Renewable resources generated about 11% of the energy produced within New England, including 5.6% from wood, refuse, and landfill gas; 4.4% from wind; and 1.5% from solar resources. Hydroelectric resources generated 6.2%.
The impact of the month’s high natural gas prices is seen in the increase in production by oil and coal-fired resources. Because the wholesale markets select the lowest-priced resources to produce the electricity needed to meet consumer demand, oil and coal-fired resources are dispatched to run more often when they are priced lower than natural-gas-fired resources. Together, oil and coal-fired resources accounted for 13% of the energy produced in New England in January, at 11.3% and 1.7%, respectively. In all of 2021, these resources produced just 0.7% of the electricity generated in New England.
The region also received net imports of about 2,251 GWh of electricity from neighboring regions in January.
January generation in New England, by fuel source
The mix of resources used to produce the region’s electricity is a key driver of CO2 emissions. The ISO estimates these emissions through an analysis that blends data on electricity generation by fuel type with an emissions factor for each fuel developed by the Environmental Protection Agency.
January estimated CO2 emissions in New England, by fuel source (metric tons)
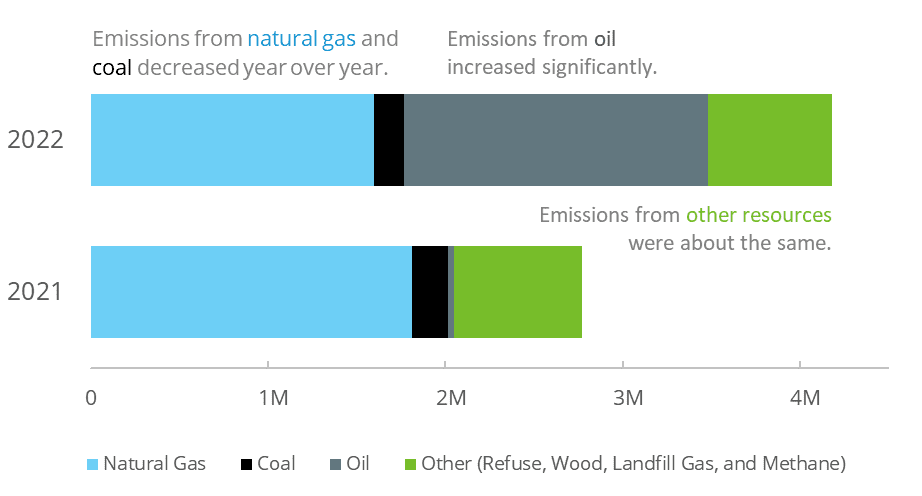
New England power plants generated an estimated 4.18 million metric tons of CO2 in January 2022, up from 2.77 million metric tons in January 2021. Heavier reliance on oil accounted for the difference, with oil-fired resources producing an estimated 1.71 million metric tons of CO2, compared to just 32,914 metric tons in January 2021. Estimated CO2 emissions from natural-gas-fired plants fell from 1.81 million metric tons in January 2021 to 1.6 million metric tons in January 2022. Emissions from coal-fired plants also fell, from 198,825 metric tons last January to 168,131 metric tons this year. CO2 emissions from other resources—mostly refuse and wood—were estimated at about 700,000 metric tons in both years.
Emissions ticked up during a one-week period when a large nuclear unit was out of service, hitting their highest level of the month on January 27, at about 195,000 metric tons. Meanwhile, natural gas plants generated nearly four times as much electricity as oil-fired generation in January, but CO2 emissions from these resources were roughly the same.
*One megawatt (MW) of electricity can serve about 750 to 1,000 average homes in New England. A megawatt-hour (MWh) of electricity can serve about 1,000 homes for one hour. One gigawatt-hour (GWh) can serve about 1 million homes for one hour.
**A British thermal unit (Btu) is used to describe the heat value of fuels, providing a uniform standard for comparing different fuels. One million British thermal units are shown as MMBtu.
***Weather-normalized demand indicates how much electricity would have been consumed if the weather had been the same as the average weather over the last 20 years.
****Since June 1, 2018, active demand-response resources have been able to participate on an hourly basis in the wholesale electricity markets. These resources reduce demand in real time.
*****A degree day is a measure of heating or cooling. A zero degree day occurs when no heating or cooling is required; as temperatures drop, more heating days are recorded; when temperatures rise, more cooling days are recorded. The base point for measuring degree days is 65 degrees. Each degree of a day’s mean temperature that is above 65 degrees is counted as one cooling degree day, while each degree of a day’s mean temperature that is below 65 degrees is counted as one heating degree day. A day’s mean temperature of 90 degrees equals 25 cooling degree days, while a day’s mean temperature of 45 degrees equals 20 heating degree days.

Historical weather data provided by DTN, LLC.; Underlying natural gas data furnished by ICE.
- Categories
- Inside ISO New England
- Tags
- monthly prices, wholesale markets