Monthly wholesale electricity prices and demand in New England, November 2021

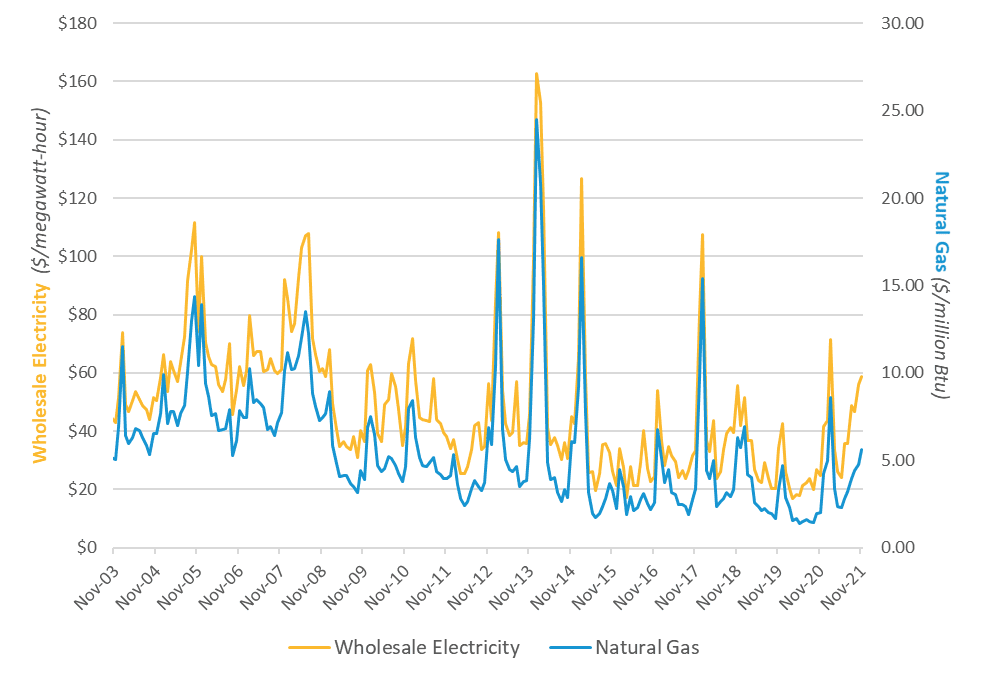
Wholesale power prices averaged $58.83 per megawatt-hour (MWh)* in the Real-Time Energy Market in November 2021, up 139% compared to the previous year. Day-Ahead Energy Market averages rose to $56.69/MWh, an increase of 126% from November 2020.
By the numbers
| November 2021 and Percent Change from November 2020 and October 2021 | November 2021 | November 2020 | October 2021 |
| Average Real-Time Electricity Price ($/megawatt-hour*) | $58.83 | 138.8% | 5.2% |
| Average Natural Gas Price ($/MMBtu**) | $5.64 | 184.8% | 18.7% |
| Peak Demand | 17,003 MWs | -0.9% | 12.0% |
| Total Electricity Use | 9,104 GWh | 1.0% | 2.8% |
| Weather-Normalized Use***** | 9,045 GWh | -1.9% | 1.6% |
Drivers of wholesale electricity prices
In general, the two main drivers of wholesale electricity prices in New England are the cost of fuel used to produce electricity and consumer demand.
Power plant fuel
Fuel is typically one of the major input costs in producing electricity. Natural gas is the predominant fuel in New England, used to generate 52% of the power produced in 2020 by New England’s power plants, and natural gas-fired power plants usually set the price of wholesale electricity in the region. As a result, average wholesale electricity prices are closely linked to natural gas prices.
The average natural gas price during November was $5.64 per million British thermal units (MMBtu)**. The price was up 185% from the November 2020 average Massachusetts natural gas index price of $1.98/MMBtu. The Mass. index price is a volume-weighted average of trades at four natural gas delivery points in Massachusetts, including two Algonquin points, the Tennessee Gas Pipeline, and the Dracut Interconnect.
November wholesale electricity and natural gas prices
Electricity demand
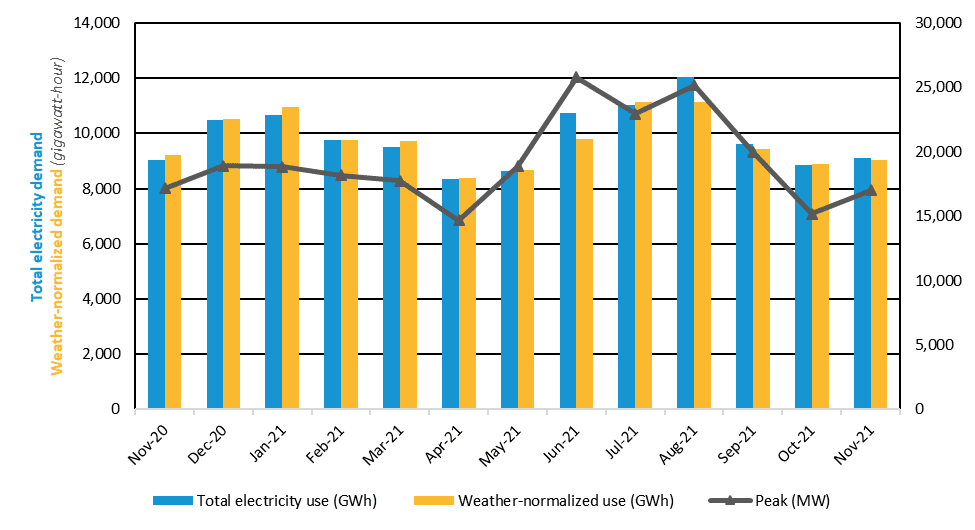
Demand is driven primarily by weather, as well as economic factors. Energy usage during November increased 1.0% to 9,104 GWh from the 9,010 GWh used in November 2020. The average temperature during November was 42˚ Fahrenheit (F) in New England, down 4˚ from the previous November. The average dewpoint, a measure of humidity, was 30˚F in November, down 5˚ from the previous November. There were 0 cooling degree days (CDD)*** during November, while the normal number of CDD in November is 0 in New England. In November 2020, there were 0 CDD. There were 690 heating degree days (HDD)*** during November, while the normal number of HDD in November is 673 in New England. In November 2020, there were 565 HDD. ISO New England is publishing weekly reports on the estimated impact on electricity demand of societal changes in response to the COVID-19 pandemic.
Consumer demand for electricity for the month peaked on November 30 during the hour from 5 to 6 p.m., when the temperature in New England was 35°F and the dewpoint was 23°. Demand reached 17,003 MW. The November 2021 peak was 0.9% lower than the November 2020 peak of 17,157 MW, set during the hour from 5 to 6 p.m. on November 18, when the temperature was 28°F and the dewpoint was 9°.
Peak demand is driven by weather, which drives the use of heating and air conditioning equipment. The all-time high winter peak was 22,818 MW, recorded during a cold snap in January 2004 when the temperature was -1°F and the dewpoint was -20°. The all-time peak demand in New England was 28,130 MW, recorded during an August 2006 heat wave, when the temperature was 94°F and the dewpoint was 74°. Air conditioning use is far more widespread than electric heating in New England, so weather tends to have a relatively greater impact on the summer peak than the winter peak.
November monthly peak demand and total and weather-normalized energy use
Fuel mix
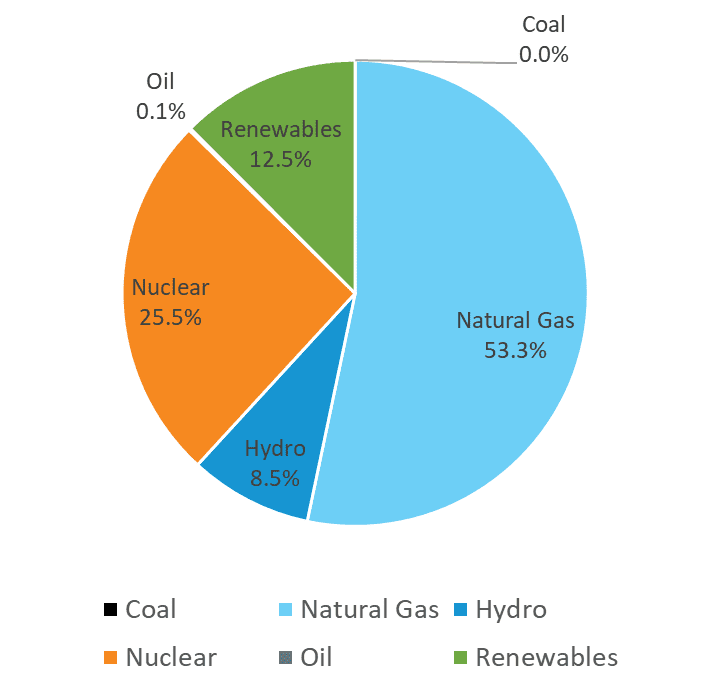
The mix of resources used in any given time period depends on price and availability, as well as supplemental resource commitments needed to ensure system stability. Natural gas-fired and nuclear generation produced about 79% of the 8,113 GWh of electric energy generated within New England during November, at about 53% and 26%, respectively. Renewable resources generated about 12% of the energy produced within New England, including 5.9% from wood, refuse, and landfill gas; 4.3% from wind; and 2.3% from solar resources. Coal resources generated less than 0.01% while oil-fired resources generated 0.1%. Hydroelectric resources generated 8.5%. The region also received net imports of about -1,856 GWh of electricity from neighboring regions.
November generation in New England, by fuel source
*One megawatt (MW) of electricity can serve about 750 to 1,000 average homes in New England. A megawatt-hour (MWh) of electricity can serve about 1,000 homes for one hour. One gigawatt-hour (GWh) can serve about 1 million homes for one hour.
**A British thermal unit (Btu) is used to describe the heat value of fuels, providing a uniform standard for comparing different fuels. One million British thermal units are shown as MMBtu.
***A degree day is a measure of heating or cooling. A zero degree day occurs when no heating or cooling is required; as temperatures drop, more heating days are recorded; when temperatures rise, more cooling days are recorded. The base point for measuring degree days is 65 degrees. Each degree of a day’s mean temperature that is above 65 degrees is counted as one cooling degree day, while each degree of a day’s mean temperature that is below 65 degrees is counted as one heating degree day. A day’s mean temperature of 90 degrees equals 25 cooling degree days, while a day’s mean temperature of 45 degrees equals 20 heating degree days.
****Since June 1, 2018, active demand-response resources have been able to participate on an hourly basis in the wholesale electricity markets. These resources reduce demand in real time.
*****Weather-normalized demand indicates how much electricity would have been consumed if the weather had been the same as the average weather over the last 20 years.

Historical weather data provided by DTN, LLC.; Underlying natural gas data furnished by ICE.
- Categories
- Industry News & Developments
- Tags
- monthly prices, wholesale markets