Regional air emissions 2018: short-term increases, but long-term reduction trends continue
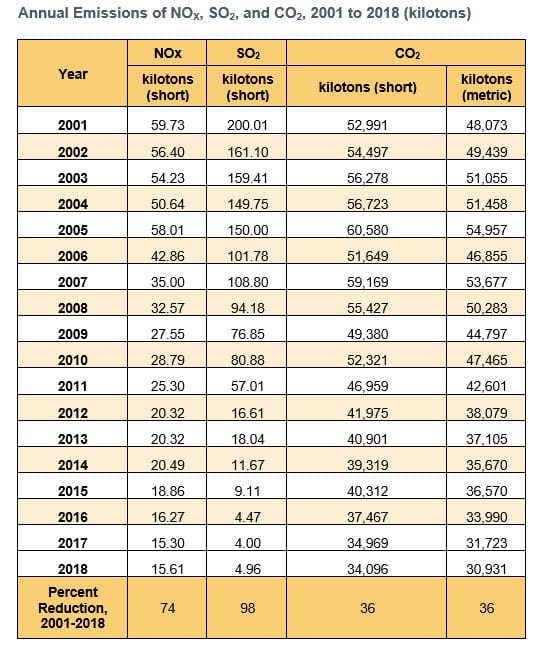
 Since 2001, SO2 down 98%, NOx down 74%, CO2 down 36%
Regional emissions of sulfur dioxide (SO2) and nitrogen oxides (NOx) increased in 2018 compared to the previous year, primarily due to a historic cold snap at the start of the year, according to data compiled for the 2018 ISO New England Electric Generator Air Emissions Report. Carbon dioxide (CO2) emissions, however, declined during the year, continuing a long-term emission reduction trend in New England.
Year-over-year changes: 2018 vs. 2017
The tables below summarize the changes for total system emissions (the amount of system emissions) and emission rates (the pounds of emissions given off, on average, with every megawatt-hour (MWh) of electricity produced) from 2017 to 2018. This is akin to comparing how many gallons of gasoline a car used versus its miles per gallon (MPG). Total emissions increased in 2018 for SO2 and NOx, but declined for CO2. Emission rates for SO2 increased, while NOx remained flat and CO2 fell.
Some highlights from the report:
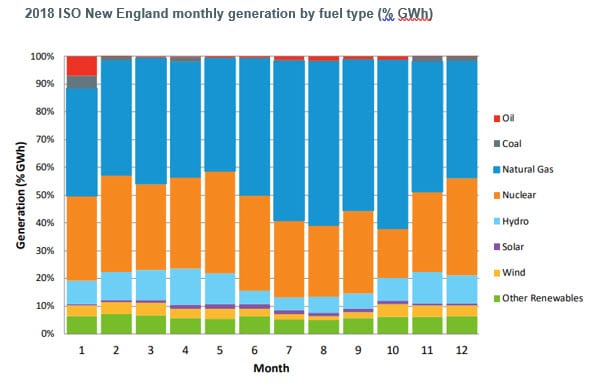
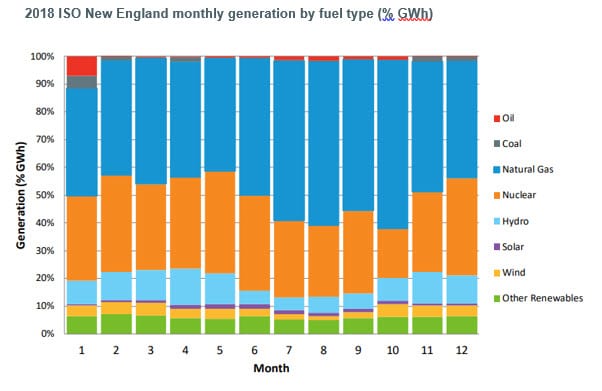
- Sharp increase oil-fired generation—Oil-fired generation increased by 57 percent in 2018 when compared to 2017. This increase primarily occurred during a brutal cold snap that hit New England at the start of the year. The cold weather drove up natural gas prices, making natural gas-fired generation more expensive than oil. During the cold snap, oil-fired generation accounted for 27 percent of generation within New England.
- Coal generation decreases—Generation from coal plants decreased by 572 GWh, or 34 percent, in 2018.
- Increased production from grid-connected solar and wind resources—Non-emitting grid-scale solar and wind resources together increased production by 435 GWh, or 10%.
The chart below shows each fuel type’s monthly contribution as a percentage of the total. Note the increase of oil generation during January.
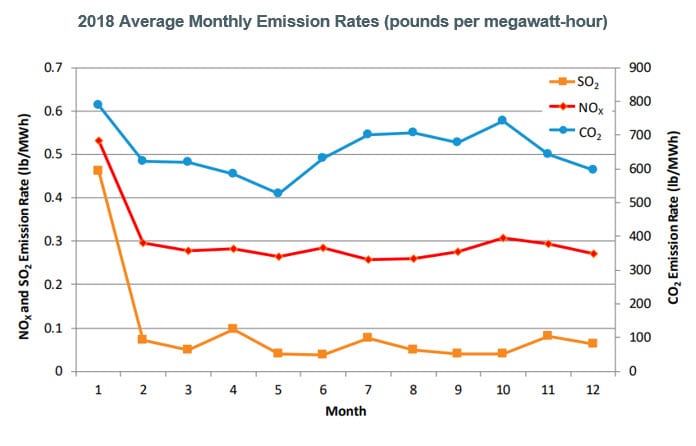
The next chart shows that the rate of emissions per megawatt-hour decreased after January.
Long-term trends: 2001–2018
Total emissions for SO2 and NOx declined from 2001 to 2017 by 98% and 74%, respectively, while CO2 emissions fell by 34%. The table below shows the total amount of air emissions on an annual basis in kilotons (kTons).
A shifting fuel mix
The type and magnitude of a generator’s emissions are directly linked to the type of fuel that powers it, and the fuel mix used to produce New England’s electricity has changed significantly over the past decade.
Percentage energy generation by fuel type, 2009 compared with 2018
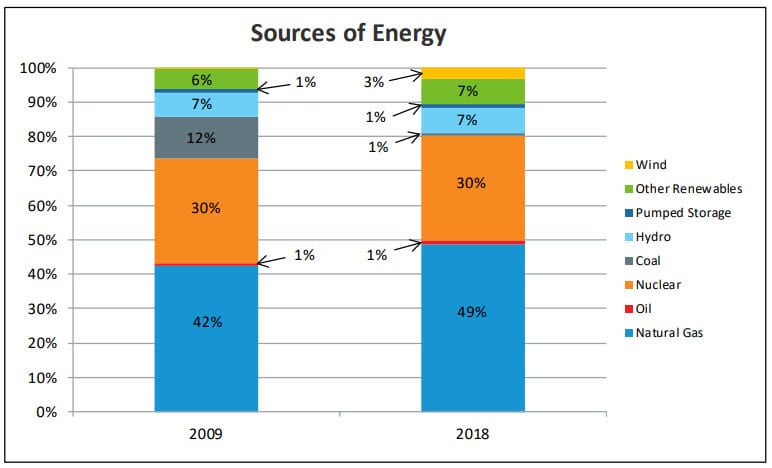
Natural gas-fired resources account for the vast majority of new generators built in New England since 1997. This ongoing trend to meet electricity needs with higher-efficiency, lower-emitting gas-fired generators instead of oil- and coal-fired generators has been the biggest contributor to the long-term decline in regional emissions. Transmission system upgrades have further reduced the need to run older, less efficient oil and coal units.
The region’s increasing development of wind, solar, and other zero-emission resources will further contribute to reducing greenhouse gases. As of January 2020, about 95% of all proposed projects in the generation interconnection queue were wind, solar, or battery projects.
More imported electricity
Since 2004, lower-priced electricity from outside New England has increasingly flowed in to serve regional demand. This external generation, which served 17% of New England’s energy needs in 2018, doesn’t count toward regional air emissions.
The 2018 generator air emissions report is based on data from the US EPA Clean Air Markets Database, NEPOOL Generator Information System (GIS) monthly data, the US EPA’s latest eGRID database, or assumed emission rates based on unit type and age.
- Categories
- Inside ISO New England
- Tags
- environment
