2019 forecast of capacity, energy, loads, and transmission is published by ISO-NE
 Energy usage and peak demand will decline slightly over the next 10 years
On May 1, 2019, the ISO published the 2019-2028 Forecast Report of Capacity, Energy, Loads, and Transmission (CELT). The report is a primary source for assumptions used in ISO system planning and reliability studies. It provides a snapshot of the New England power system, including:
- The number of megawatts (MW) with capacity supply obligations resulting from the 13 Forward Capacity Market (FCM) auctions held to date, as well as the total generating capability of resources in the region
- The breakdown of the region’s generators by fuel type
- A link to the listing of transmission projects proposed, planned, and under construction
- The long-term forecast for energy consumption and peak demand, including the contributions of energy efficiency and behind-the-meter solar facilities
The long-term forecast for electricity use is developed each year using state and regional economic forecasts, 25 years of weather history in New England, results of both the ISO’s energy-efficiency (EE) forecast and solar photovoltaic (PV) forecast, and other factors. The ISO calculates a gross forecast and then applies the EE and PV forecasts to develop a net forecast.
The 2019 CELT projects that both energy usage and peak demand will decline slightly in New England over the 10-year period. The primary factors are continuing robust installation of energy-efficiency measures and behind-the-meter solar arrays throughout the region.
CELT projections for 2019 to 2028
Gross forecast, not including EE and behind-the-meter PV
- Overall electricity use in New England is expected to grow 1.1% annually over the 10-year period, from the expected 145,610 gigawatt-hours (GWh) this year to 161,312 GWh in 2028
- Peak demand under typical summer peak weather conditions (the “50/50” forecast) is expected to rise annually at a rate of 0.7%, from 28,943 megawatts (MW) this year to 30,831 MW in summer 2028 (peak demand is a measure of the highest amount of electricity used in a single hour)
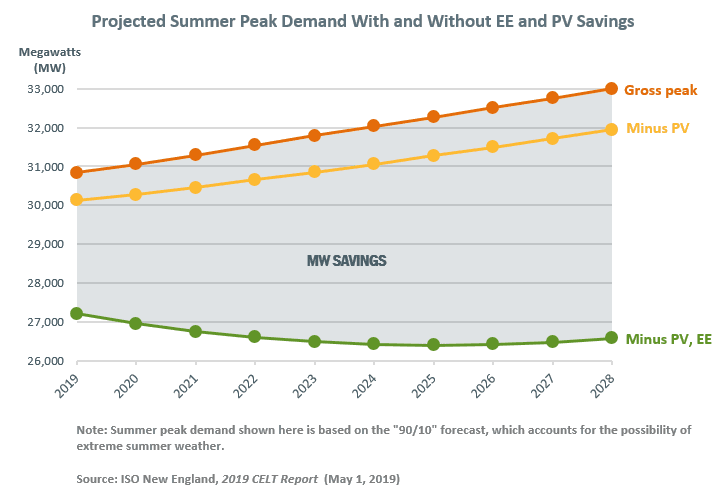
- Peak demand under extreme summer peak weather (the “90/10” forecast), such as an extended heat wave, pushes the gross forecast for peak demand up to 30,832 MW in 2019 and 32,999 MW in 2028—an average annual growth rate of 0.8%
- Winter peak demand under typical winter peak weather conditions (the “50/50” forecast) is expected to rise by an average 0.6% annually, from 23,144 MW this year to 24,376 MW in 2028
- Winter peak demand under extreme winter peak weather (the “90/10” forecast) is forecasted to rise by an average 0.6% annually as well, from 23,841 MW this year to 25,138 MW in 2028
Net forecast, including latest EE and behind-the-meter PV forecasts
- Overall electricity use is expected to decline, by -0.4% annually, from 125,823 GWh this year to 121,336 GWh in 2028
- EE is projected to save the region an average of 1,940 GWh annually
- PV is projected to produce about 2,490 GWh of total annual energy savings in 2019, rising to about 5,222 GWh in 2028
- Peak demand under typical summer peak weather conditions is expected to fall slightly, by -0.4% over the 10-year period, from 25,323 MW this year to 24,408 MW in 2028. The net forecast includes peak demand reductions of:
- 273 MW annually, on average, as a result of EE
- 708 MW this year and rising to 1,051 MW in summer 2028 as a result of behind-the-meter PV
- Peak demand under extreme summer peak weather is expected to remain essentially flat, with a slight -0.3% annual decline, from 27,212 MW in 2019 to 26,576 MW in 2028
- Winter peak demand is forecasted to decline an average of about -0.6% annually, under both normal and extreme conditions. For normal winter weather, peak demand is expected to slide from 20,476 MW this year to 19,368 MW in 2028; for extreme winter weather, the peak is forecasted to drop from 21,173 MW this year to 20,130 MW in 2028

2018 energy and demand
In 2018, actual energy usage rose 1.8%, from 121,216 GWh in 2017 to 123,360 GWh last year, primarily due to a hotter summer in 2018 than 2017, which caused greater demand for cooling. If normal weather had occurred in both years, energy usage would have been flat with a 0.1% decline as well, from a weather-normalized value of 120,668 GWh in 2017 to 120,560 GWh last year.
In 2018, actual demand peaked at 26,024 MW on August 29, 2018, during the hour from 4 to 5 p.m. Without the energy-efficiency measures installed in New England, as well as reductions by demand-response resources, price-responsive demand-side resources, and behind-the-meter solar resources, the peak would have come in at about 29,898 MW.
During winter 2018/2019, demand peaked at 20,740 MW during the hour from 5 to 6 p.m. on January 21, 2019. Without active demand-response resources and energy-efficiency measures, the peak would have been 23,925 MW. Behind-the-meter solar does not contribute to reducing winter peak load because demand peaks in winter after the sun has set.
Learn more
- For more information on the 2019 CELT, detailed forecasts and models are available on the Load Forecast webpage
- Get key statistics on New England’s electricity use and resource mix
- Track load in real time via ISO Express
- Categories
- Inside ISO New England
- Tags
- demand resources, energy efficiency, forecast, forward capacity market, solar