Monthly wholesale electricity prices and demand in New England, October 2018
 Wholesale power and natural gas prices rose in October
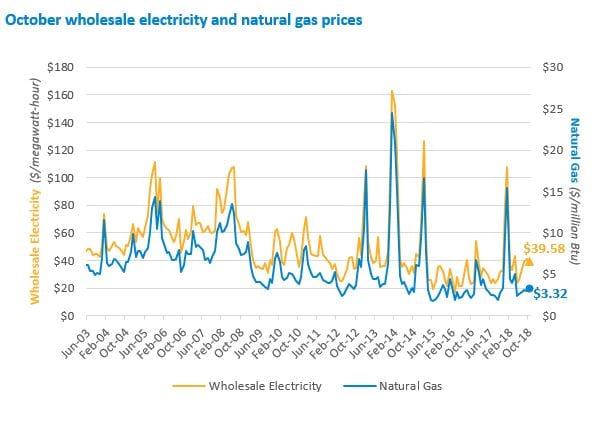
Increased natural gas prices, coupled with planned refueling outages of two nuclear units, pushed up average wholesale power prices for the month of October 2018 in both the Day-Ahead and Real-Time Energy Markets when compared to the previous year. The day-ahead energy price was up 29.3% to $38.46 per megawatt-hour (MWh)* and the real-time energy price rose 24.8% to $39.58/MWh.
Drivers of wholesale electricity prices
In general, the two main drivers of wholesale electricity prices in New England are the cost of fuel used to produce electricity and consumer demand.
Power plant fuel: Fuel is typically one of the major input costs in producing electricity. Natural gas is the predominant fuel in New England, used to generate 48% of the power produced in 2017 by New England’s power plants, and natural gas-fired power plants usually set the price of wholesale electricity in the region. As a result, average wholesale electricity prices are closely linked to natural gas prices.
The average natural gas price during October was $3.32 per million British thermal units (MMBtu)**. The price rose 20.3% from the October 2017 average Massachusetts natural gas index price of $2.76/MMBtu. The Mass. index price is a volume-weighted average of trades at four natural gas delivery points in Massachusetts, including two Algonquin points, the Tennessee Gas Pipeline, and the Dracut Interconnect.
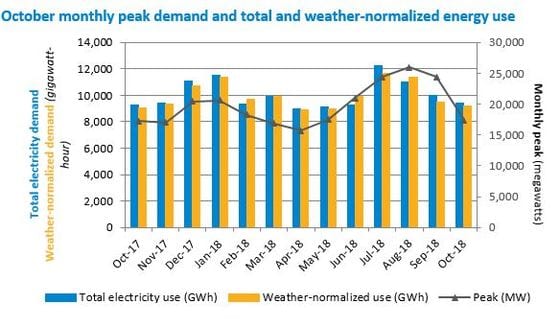
Electricity demand: Demand is driven primarily by weather, as well as economic factors. Energy usage during October 2018 rose by 1.2% to 9,393 GWh from the 9,283 GWh used in October 2017. The average temperature during October was 51˚ Fahrenheit (F) in New England, an 8 degree decrease from the previous October. The average dewpoint, a measure of humidity, was 43˚F in October 2018, up from 40˚F in October 2017. There were 430 heating degree days (HDD)*** during October 2018, more than double the 201 HDD seen in October 2017. The normal number of HDD in October is 399 in New England.
Consumer demand for electricity for the month peaked on October 10 during the hour from 6 to 7 p.m., when the temperature in New England was 77°F and the dewpoint was 66°. Demand reached 17,416 MW, with 19 MW met through reductions by active demand resources****. The October 2018 peak was 0.9% higher than the October 2017 peak of 17,255 MW, set during the hour from 6 to 7 p.m. on October 9, 2017, when the temperature was 70°F and the dewpoint was 69°.
Peak demand is driven by weather, which drives the use of heating and air conditioning equipment. The all-time peak demand in New England was 28,130 MW, recorded during an August 2006 heat wave, when the temperature was 94°F and the dewpoint was 74°. The all-time high winter peak was 22,818 MW, recorded during a cold snap in January 2004 when the temperature was -1°F and the dewpoint was
-20°. Air conditioning use is far more widespread than electric heating in New England, so weather tends to have a relatively greater impact on the summer peak than the winter peak.
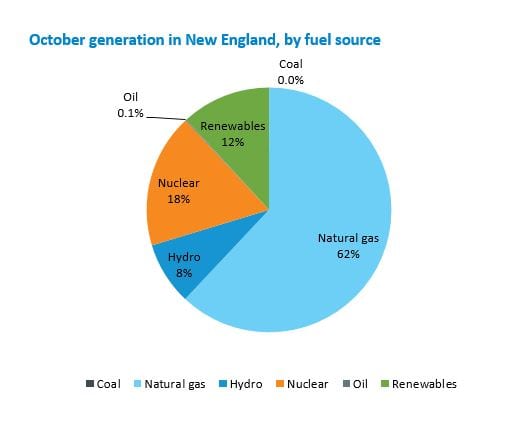
Fuel mix: The mix of resources used in any given time period depends on price and availability, as well as supplemental resource commitments needed to ensure system stability. Natural gas-fired and nuclear generation produced about 80% of the 7,569 GWh of electric energy generated within New England during October, at about 62% and 18%, respectively. Renewable resources generated about 12% of the energy produced within New England, including 6.2% from wood, refuse, and landfill gas; 4.6% from wind; and 1.1% from solar resources. Coal- and oil-fired units produced under 1%, combined, of the energy generated within New England. Hydroelectric resources in New England generated 8.3%. The region also received net imports of about 1,977 GWh of electricity from neighboring regions, and active demand response accounted for 3.2 GWh of reduced system demand.
| October 2018 and Percent Change from October 2017 and September 2018 |
October 2018 | Change from October 2017 | Change from September 2018 |
|---|---|---|---|
| Average Real-Time Electricity Price ($/megawatt-hour*) |
$39.58 | +24.8% | -3.9% |
| Average Natural Gas Price ($/MMBtu**) |
$3.32 | +20.3% | +13.7% |
| Peak Demand | 17,416 MW | +0.9% | -28.6% |
| Total Electricity Use | 9,393 GWh | +1.2% | -6.3% |
| Weather-Normalized Use***** | 9,213 GWh | +1.5% | -2.6% |
*One megawatt (MW) of electricity can serve about 750 to 1,000 average homes in New England. A megawatt-hour (MWh) of electricity can serve about 750 to 1,000 homes for one hour. One gigawatt-hour (GWh) can serve about 750,000 to 1 million homes for one hour. **A British thermal unit (Btu) is used to describe the heat value of fuels, providing a uniform standard for comparing different fuels. One million British thermal units are shown as MMBtu. ***A degree day is a measure of heating or cooling. A zero degree day occurs when no heating or cooling is required; as temperatures drop, more heating days are recorded; when temperatures rise, more cooling days are recorded. The base point for measuring degree days is 65 degrees. Each degree of a day’s mean temperature that is above 65 degrees is counted as one cooling degree day, while each degree of a day’s mean temperature that is below 65 degrees is counted as one heating degree day. A day’s mean temperature of 90 degrees equals 25 cooling degree days, while a day’s mean temperature of 45 degrees equals 20 heating degree days. ****Since June 1, 2018, active demand-response resources have been able to participate on an hourly basis in the wholesale electricity markets. These resources reduce demand in real time.*****Weather-normalized demand indicates how much electricity would have been consumed if the weather had been the same as the average weather over the last 20 years.
 Historical weather data provided by DTN, LLC.; Underlying natural gas data furnished by ICE
- Categories
- Industry News & Developments
- Tags
- monthly prices