Monthly wholesale electricity prices and demand in New England, January 2018
 Energy market value in January totaled $1.3 billion, second only to January 2014
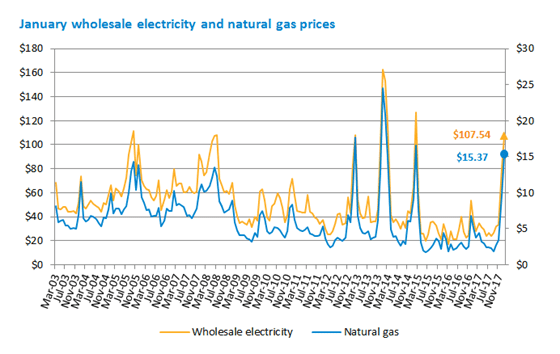
Extreme cold weather at the beginning of January caused the average price of natural gas to triple during the month, causing the price of wholesale power to nearly triple as well, compared to January 2017.
The cold spell began December 26 continued through January 8, raising demand for natural gas and wholesale electricity. The resulting increase in wholesale power prices during January, to $107.54 per megawatt-hour (MWh)* for the real-time price average and $108.75/MWh for the day-ahead average, coupled with a 7% increase in power demand, tripled the total energy market value to $1.3 billion for the month. That compares to $457 million in total energy transactions just one year before, during January 2017. January 2017 had the second-lowest energy market value of any January during the 15 years of wholesale markets in their current form. The highest energy market value was observed during January 2014—also a cold and stormy month, which had the highest monthly natural gas prices so far—at $2.2 billion.
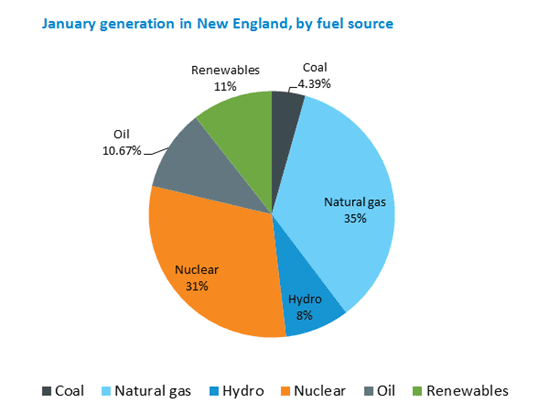
The extreme cold weather and the resulting spike in natural gas prices actually pushed the cost of natural-gas-fired generators higher than coal- and oil-fired generators. As a result, coal- and oil-fired generators were used more frequently than natural-gas-fired generators during part of the month. The shift is illustrated in the fuel mix, with coal and oil producing about 15% of the electricity generated by power plants in New England. These units, while still needed in winter, rarely run—in 2017, they generated just 2.3% of the energy produced in New England. Typically, natural-gas-fired generators produce nearly half of the power in New England, but in January they produced 35%.
January highlights:
- Eighth-highest monthly average real-time energy prices (per MWh); highest was $162.88/MWh in January 2014.
- Second-highest January energy market value:
- January 2014: $2.190 billion
- January 2018: $1.340 billion
- January 2008: $1.096 billion
- January 2013: $1.085 billion
- January 2004: $1.077 billion
- Fifth-highest natural gas price (per million British thermal units (MMBtu)**:
- January 2014: $24.50
- February 2014: $20.85
- February 2013: $17.63
- February 2015: $16.61
- January 2018: $15.37
Drivers of Wholesale Electricity Prices
In general, the two main drivers of wholesale electricity prices in New England are the cost of fuel used to produce electricity and consumer demand.
Power Plant Fuel: Fuel is typically one of the major input costs in producing electricity. Natural gas is the predominant fuel in New England, used to generate 48% of the power produced in 2017 by New England’s power plants, and natural gas-fired power plants usually set the price of wholesale electricity in the region. As a result, average wholesale electricity prices are closely linked to natural gas prices.
The average natural gas price during January was $15.37/MMBtu**, up 200.6% from the January 2017 average Massachusetts natural gas index price of $5.11/MMBtu. The Mass. index price is a volume-weighted average of trades at four natural gas delivery points in Massachusetts, including two Algonquin points, the Tennessee Gas Pipeline, and the Dracut Interconnect. The January average natural gas price was up 58.3% from the previous month’s price of $9.71/MMBtu.
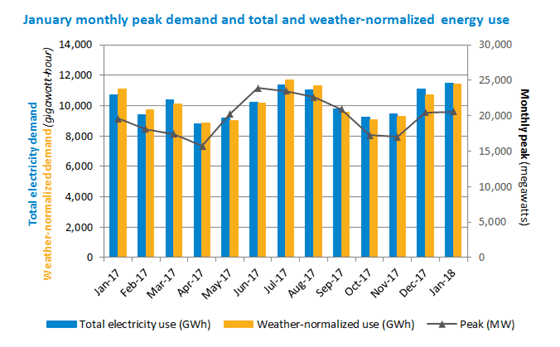
Electricity Demand: Demand is driven primarily by weather as well as economic factors. Energy usage during January 2018 rose 7.2% to 11,493 gigawatt-hours (GWh) from the 10,724 GWh used in January 2017. The average temperature during January was 26˚ Fahrenheit (F) in New England, down from the 33˚ average temperature recorded during the previous January. The average dewpoint, a measure of humidity, was 15˚F, compared to 23˚F in January 2017. The number of heating degree days (HDD)*** came in at 1,212 in January, compared to 1,005 HDD in January 2017. The normal January level is 1,192 HDD in New England. There were no cooling degree days in January.
Peak demand for the month was recorded at 20,599 MW on January 5 during the hour from 5 to 6 p.m., when the temperature in New England was 8°F and the dewpoint was -8°. The January 2018 peak was 5.1% higher than the January 2017 peak of 19,592 MW, set during the hour from 5 to 6 p.m. on January 9, when the temperature was 17°F and the dewpoint was 2°.
Peak demand is driven by weather, which drives the use of heating and air conditioning equipment. The all-time high winter peak was 22,818 MW, recorded during a cold snap in January 2004 when the temperature was -1°F and the dewpoint was -20°. The all-time peak demand in New England was 28,130 MW, recorded during an August 2006 heat wave, when the temperature was 94°F and the dewpoint was 74°. Air conditioning use is far more widespread than electric heating in New England, so weather tends to have a relatively greater impact on the summer peak than the winter peak.
Fuel Mix: The mix of resources used in any given time period depends on price and availability, as well as supplemental resource commitments needed to ensure system stability. Natural gas-fired and nuclear generation produced 65.7% of the 9,466 gigawatt-hours (GWh) of electric energy generated within New England during January, at about 35.2% and 30.5%, respectively. Renewable resources generated about 11% of the energy produced within New England, including 7% from wood, refuse, and landfill gas; 4% from wind; and 0.5% from solar resources. Coal units generated 4.4%, and oil-fired resources produced 11% of the energy generated within New England. Hydroelectric resources in New England generated 8%. The region also received net imports of about 2,148 GWh of electricity from neighboring regions.
| January 2018 and Percent Change from January 2017 and December 2017 |
January 2018 | Change from January 2017 | Change from December 2017 |
|---|---|---|---|
| Average Real-Time Electricity Price ($/megawatt-hour*) |
$107.54 | +193.3% | +34.6% |
| Average Natural Gas Price ($/MMBtu**) |
$15.37 | +200.6% | +58.3% |
| Peak Demand | 20,599 MW | +5.1% | +0.6% |
| Total Electricity Use | 11,493 GWh | +7.2% | +3.7% |
| Weather-Normalized Use**** | 11,393 GWh | +2.5% | +6.3% |
*One megawatt (MW) of electricity can serve about 1,000 average homes in New England. A megawatt-hour (MWh) of electricity can serve about 1,000 homes for one hour. One gigawatt-hour (GWh) can serve about 1 million homes for one hour. **A British thermal unit (Btu) is used to describe the heat value of fuels, providing a uniform standard for comparing different fuels. One million British thermal units are shown as MMBtu. ***A degree day is a measure of heating or cooling. A zero degree day occurs when no heating or cooling is required; as temperatures drop, more heating days are recorded; when temperatures rise, more cooling days are recorded. The base point for measuring degree days is 65 degrees; each degree of a day’s mean temperature that is below 65 degrees is counted as one heating degree day. A day’s mean temperature of 45 degrees equals 20 heating degree days. ****Weather-normalized demand indicates how much electricity would have been consumed if the weather had been the same as the average weather over the last 20 years.
![]()
- Categories
- Industry News & Developments
- Tags
- monthly prices, wholesale prices