Significant price variation on May 18 highlights operational challenges of operating the grid during spring and fall
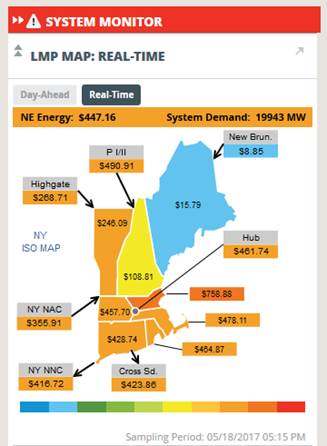
Real-time prices ranged from a high of $758.88 MWh in the northeastern Massachusetts and Boston pricing zone to a low of -$71.07 MWh price for power from New Brunswick
Thursday, May 18, 2017, was a hot one. If you have an interest in energy, you may have checked the New England locational marginal pricing (LMP) map that day, expecting to see prices rise across the region, responding to the hotter than normal weather. Instead, you saw an unusual, rainbow-like effect on the map, indicating a wide variation in real-time wholesale electricity prices. The real-time price spread was caused by challenging power grid circumstances that can occur mainly during spring and fall (but also any time of year, depending on resource availability): when unseasonable weather drives a spike in demand while major energy infrastructure is offline for maintenance.
Spring and fall, or “shoulder seasons,” are typically the best times for generators and transmission owners to schedule maintenance, inspections, or other work on their resources, because consumer demand is generally lower than during the summer and winter peak seasons. On May 18, over 7,600 megawatts (MW) of generation were unavailable mostly due to planned outages and reductions, and a number of transmission outages had been scheduled around northeastern Massachusetts and the Boston area as part of upgrade projects.
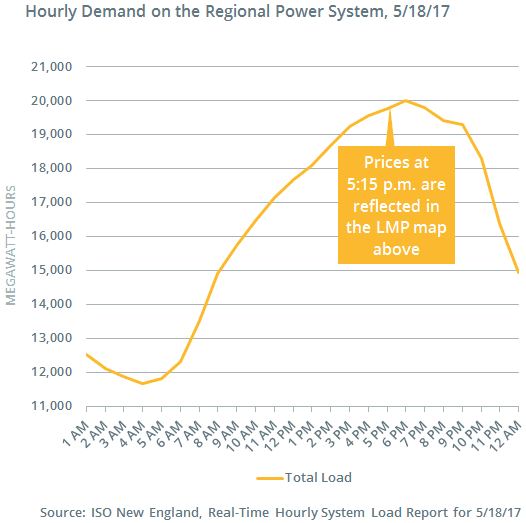
However, areas across New England reached record-high temperatures that day, and the system peaked at just over 20,000 MW. The typical spring peak ranges from about 15,000 MW to 16,900 MW.
Procedure implemented to ensure reliability
As a precaution, ISO system operators implemented a Master/Local Control Center Procedure No. 2 (M/LCC 2) alert for the region from 9:30 a.m. to 10:00 p.m. The M/LCC 2 notification requests power system personnel and wholesale electricity market participants to stop or postpone any routine maintenance, construction, or testing to avoid further jeopardizing power system operations.
Prices went up in some areas and down in others
While the system continued to operate reliably, the combination of high demand and transmission constraints caused the notable real-time price separation shown above. Generally speaking:
- Prices rose in many places across the region as more expensive power resources had to be called on to help meet high demand or to run more locally in areas where transmission constraints blocked the incoming flow of lower-cost energy.
- Prices fell in areas of northern New England, where transmission limitations and outages locked in energy that day. Wind farms have been added in some of these remote areas where the existing transmission system is too constrained to carry out high levels of power generation. As a result, there are times on windy days when not all the power from those wind farms can be transported out. The negative prices essentially indicated resources’ willingness to pay to keep operating, rather than being dispatched down or off line to prevent overloading the transmission system. (Read more about negative prices in the energy market, which were enabled in late 2014.)
The real-time market typically accounts for a small portion of overall wholesale energy market payments. Over the past five years, more than 95 percent of New England’s wholesale energy payments were determined in the day-ahead market, with less than 5 percent coming from the real-time market.
Learn more
- Categories
- Inside ISO New England
- Tags
- peak demand, weather, wholesale prices, wind