Monthly wholesale electricity prices and demand in New England, January 2017

January’s average price of electricity rose on higher natural gas prices
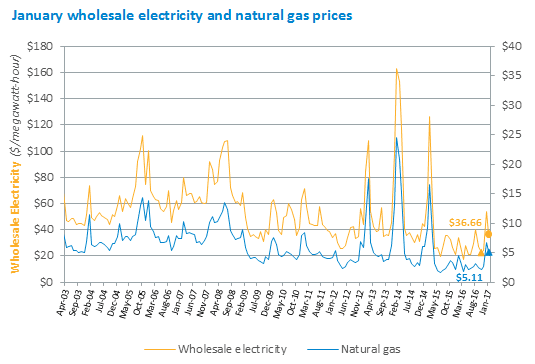
The average price of natural gas rose 14% during January 2017, pushing up the wholesale power price in New England by 8%, to $36.66 per megawatt-hour (MWh)*, from the January 2016 price of $33.99/MWh.
The smaller percentage increase in wholesale power prices compared to the natural gas increase was due to lower demand, as well as changes in the fuel mix in January. Total energy consumption in New England declined by 3% in January, compared to the previous January. Nuclear output was lower in January 2016, by about 200 gigawatt-hours (GWh) or 7.6% to 2,988 GWh, likely requiring the use of higher-priced resources. And output from low-priced wind resources was higher in January 2017, up by 48 GWh or 20% to 298 GWh, likely displacing some higher-priced resources.
Drivers of Wholesale Electricity Prices
In general, the two main drivers of wholesale electricity prices in New England are the cost of fuel used to produce electricity and consumer demand.
Power Plant Fuel: Fuel is typically one of the major input costs in producing electricity. Natural gas is the predominant fuel in New England, used to generate 49% of the power produced in the region last year, and natural gas-fired power plants usually set the price of wholesale electricity in the region. As a result, average wholesale electricity prices are closely linked to natural gas prices.
The average natural gas price during January was $5.11 per million British thermal units (MMBtu)**, up 14% from the January 2016 average Massachusetts natural gas index price of $4.48/MMBtu. This monthly price report is switching from the Algonquin citygates price to the Mass. index price, which is a volume-weighted average of trades at four natural gas delivery points in Massachusetts, including two Algonquin points, the Tennessee Gas Pipeline, and the Dracut Interconnect. The January average natural gas price was down almost 25% from the December 2016 monthly average of $6.75/MMBtu.
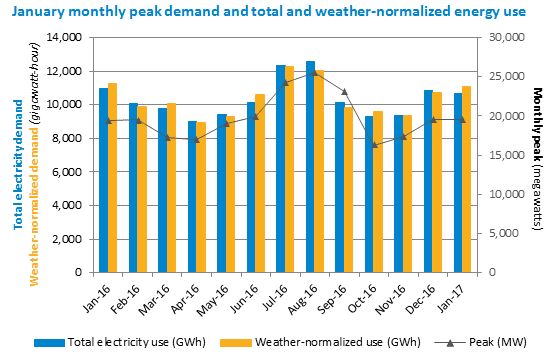
Electricity Demand: Demand is driven primarily by weather as well as economic factors. Energy usage during January 2017 dropped 3.0% to 10,689 gigawatt-hours (GWh) from the 11,015 GWh used in January 2016. The average temperature during January was 33˚ Fahrenheit in New England compared to the 30˚ Fahrenheit average recorded during the previous January. The average dewpoint, a measure of humidity, came in at 23˚F, compared to 17˚F in January 2016. The number of heating degree days (HDD)*** totaled 1,005 in January, compared to 1,092 HDD in January 2016. The normal January level is 1,192 HDD in New England.
Peak demand for the month was recorded at 19,570 MW on January 9 during the hour from 5 to 6 p.m., when the temperature in New England was 17°F and the dewpoint was 2°. The January 2017 peak was up 0.6% from the January 2016 peak of 19,451 MW, set during the hour from 6 to 7 p.m. on January 19, 2016, when the temperature was 21°F and the dewpoint was 5°.
Peak demand is driven by weather, which drives the use of heating and air conditioning equipment. The all-time peak demand in New England was 28,130 MW, recorded during an August 2006 heat wave, when the temperature was 94°F and the dewpoint was 74°. Air conditioning use is far more widespread than electric heating in New England, so weather tends to have a relatively greater impact on the summer peak than the winter peak. The all-time high winter peak was 22,818 MW, recording during a cold snap in January 2004 when the temperature was -1°F and the dewpoint was -20°.
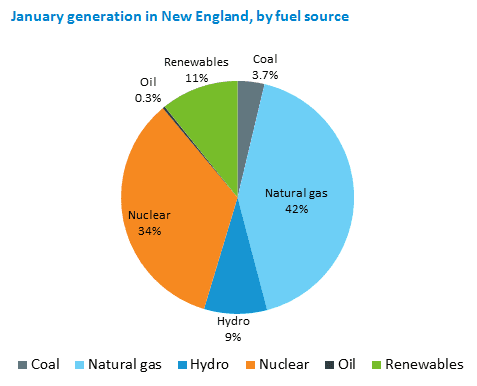
Fuel Mix: The mix of resources used in any given time period depends on price and availability, as well as supplemental resource commitments needed to ensure system stability. Natural gas-fired and nuclear power plants produced most of the 8,721 gigawatt-hours (GWh) of electric energy generated within New England during January, at about 42% and 34%, respectively. Hydroelectric resources in New England generated 9%. Renewable resources generated about 11% of the energy produced within New England, including 7% from wood, refuse, and landfill gas; 3.4% from wind; and 0.3% from solar resources. Coal units generated 3.7%, and oil-fired resources produced 0.3% of the energy generated within New England. The region also received net imports of about 2,114 GWh of electricity from neighboring regions.
| January 2017 and Percent Change from January 2016 and December 2016 |
January 2017 | Change from January 2016 | Change from December 2016 |
|---|---|---|---|
| Average Real-Time Electricity Price ($/megawatt-hour*) |
$36.66 | +7.8% | -31.9% |
| Average Natural Gas Price ($/MMBtu**) |
$5.11 | +14.0% | -24.3% |
| Peak Demand | 19,570 MW | +0.6% | -0.06% |
| Total Electricity Use | 10,689 GWh | -3.0% | -1.4% |
| Weather-Normalized Use**** | 11,116 GWh | -1.1% | +4.0% |
* One megawatt (MW) of electricity can serve about 1,000 average homes in New England. A megawatt-hour (MWh) of electricity can serve about 1,000 homes for one hour. One gigawatt-hour (GWh) can serve about one million homes for one hour.
** A British thermal unit (Btu) is used to describe the heat value of fuels, providing a uniform standard for comparing different fuels. One million British thermal units are shown as MMBtu.
*** A degree day is a measure of heating or cooling. A zero degree day occurs when no heating or cooling is required; as temperatures drop, more heating days are recorded; when temperatures rise, more cooling days are recorded. The base point for measuring degree days is 65 degrees. Each degree of a day’s mean temperature that is above 65 degrees is counted as one cooling degree day, while each degree of a day’s mean temperature that is below 65 degrees is counted as one heating degree day. A day’s mean temperature of 90 degrees equals 25 cooling degree days, while a day’s mean temperature of 45 degrees equals 20 heating degree days.
**** Weather-normalized demand indicates how much electricity would have been consumed if the weather had been the same as the average weather over the last 20 years
![]()
- Categories
- Industry News & Developments
- Tags
- monthly prices, wholesale prices