Monthly wholesale electricity prices and demand in New England, December 2016

December’s average price of electricity rose on colder temperatures, higher demand, and higher natural gas prices
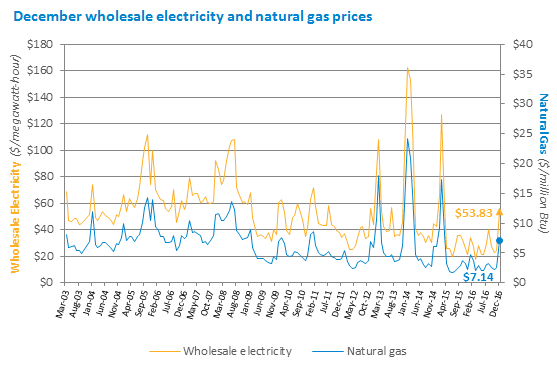
The average price of natural gas more than tripled during December 2016 and that, combined with higher demand for power, caused the wholesale power price in New England to rise more than twice as high as the price in December 2015.
The price of natural gas rose 226% in December, driving a 152% increase in the wholesale electricity price, to $53.83 per megawatt-hour (MWh)* from the December 2015 average price of $21.35/MWh.
December’s cold temperatures pushed up demand for power. As measured by heating degree days**, December 2016 was much colder than December 2015, and much closer to the normal level of heating degree days during a New England December. Cold weather also drives up demand for natural gas for heating, resulting in natural gas pipeline constraints that cause natural gas prices to rise.
Drivers of Wholesale Electricity Prices
In general, the two main drivers of wholesale electricity prices in New England are the cost of fuel used to produce electricity and consumer demand.
Power Plant Fuel: Fuel is typically one of the major input costs in producing electricity. Natural gas is the predominant fuel in New England, used to generate 49% of the power produced in the region last year, and natural gas-fired power plants usually set the price of wholesale electricity in the region. As a result, average wholesale electricity prices are closely linked to natural gas prices.
The average natural gas price during December was $7.14 per million British thermal units (MMBtu)***, three times higher than the December 2015 average price of $2.19/MMBtu at the Algonquin pipeline delivery point in Massachusetts. The December average natural gas price was 171% higher than the November 2016 monthly average of $2.63/MMBtu.
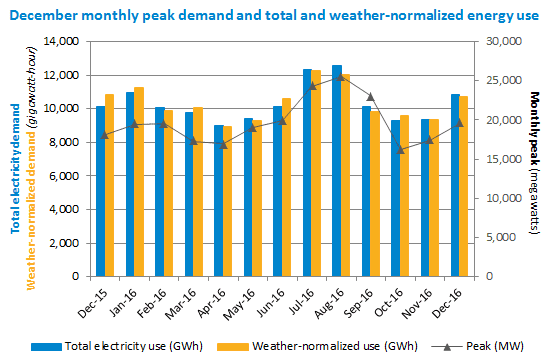
Electricity Demand: Demand is driven primarily by weather as well as economic factors. Energy usage during December 2016 rose 6.4% to 10,840 gigawatt-hours (GWh) from the 10,188 GWh used in December 2015. The average temperature during December was 32˚ Fahrenheit in New England compared to the 43˚ Fahrenheit average recorded during the previous December. The average dewpoint, a measure of humidity, came in at 21˚F, compared to 35˚F in December 2015. The number of heating degree days (HDD) totaled 1,012 in December, compared to 694 HDD in December 2015. The normal December level is 1,020 HDD in New England.
Peak demand for the month was recorded at 19,581 MW on December 15 during the hour from 5 to 6 p.m., when the temperature in New England was 18°F and the dewpoint was -9°. The December 2016 peak was up 7.5% from the December 2015 peak of 18,207 MW, set during the hour from 5 to 6 p.m. on December 29, 2015, when the temperature was 29°F and the dewpoint was 27°.
Peak demand is driven by weather, which drives the use of heating and air conditioning equipment. The all-time peak demand in New England was 28,130 MW, recorded during an August 2006 heat wave, when the temperature was 94°F and the dewpoint was 74°. Air conditioning use is far more widespread than electric heating in New England, so weather tends to have a relatively greater impact on the summer peak than the winter peak. The all-time high winter peak was 22,818 MW, recording during a cold snap in January 2004 when the temperature was -1°F and the dewpoint was -20°.
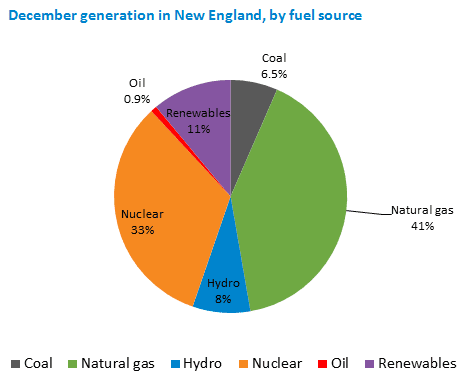
Fuel Mix: The mix of resources used in any given time period depends on price and availability, as well as supplemental resource commitments needed to ensure system stability. Natural gas-fired and nuclear power plants produced most of the 8,713 gigawatt-hours (GWh) of electric energy generated within New England during December, at about 41% and 33%, respectively. Hydroelectric resources in New England generated 8%. Renewable resources generated about 11% of the energy produced within New England, including 7% from wood, refuse, and landfill gas; 3.6% from wind; and 0.4% from solar resources. Coal units generated 6.5%, and oil-fired resources produced 0.9% of the energy generated within New England. The region also received net imports of about 2,300 GWh of electricity from neighboring regions.
| December 2016 and Percent Change from December 2015 and November 2016 |
December 2016 | Change from December 2015 | Change from November 2016 |
|---|---|---|---|
| Average Real-Time Electricity Price ($/megawatt-hour*) |
$53.83 | +152.1% | +121.5% |
| Average Natural Gas Price ($/MMBtu**) |
$7.14 | +226.1% | +171.4% |
| Peak Demand | 19,581 MW | +7.5% | +12.3% |
| Total Electricity Use | 10,840 GWh | +6.4% | +15.7% |
| Weather-Normalized Use**** | 10,732 GWh | -0.8% | +14.5% |
* One megawatt (MW) of electricity can serve about 1,000 average homes in New England. A megawatt-hour (MWh) of electricity can serve about 1,000 homes for one hour. One gigawatt-hour (GWh) can serve about one million homes for one hour.
** A British thermal unit (Btu) is used to describe the heat value of fuels, providing a uniform standard for comparing different fuels. One million British thermal units are shown as MMBtu.
*** A degree day is a measure of heating or cooling. A zero degree day occurs when no heating or cooling is required; as temperatures drop, more heating days are recorded; when temperatures rise, more cooling days are recorded. The base point for measuring degree days is 65 degrees. Each degree of a day’s mean temperature that is above 65 degrees is counted as one cooling degree day, while each degree of a day’s mean temperature that is below 65 degrees is counted as one heating degree day. A day’s mean temperature of 90 degrees equals 25 cooling degree days, while a day’s mean temperature of 45 degrees equals 20 heating degree days.
**** Weather-normalized demand indicates how much electricity would have been consumed if the weather had been the same as the average weather over the last 20 years
![]()
- Categories
- Inside ISO New England
- Tags
- monthly prices, wholesale prices