ISO-NE marks Earth Day 2016 with an update on energy-efficiency, solar, and wind resources in New England
 How the region is on its way to meeting states’ “green power” goals
New Englanders take note: as the world marks the 46th annual Earth Day on Friday, April 22, widespread efforts are well underway here, in our six-state region, to develop cleaner sources of electric energy and reduce electricity use. ISO New England has been working closely with both the states and industry stakeholders to help quantify and integrate regional developments related to energy-efficiency (EE) programs and wind and solar resources, two renewable sources of power.
Ambitious renewable energy goals are having clear results
Their total capacity value is relatively small today: wind, solar, and all other renewable sources of generation, when taken together (except pumped storage), only make up about 9% of the region’s capacity. However, these resources are an important and ever-growing part of New England’s resource portfolio, and the ISO’s forecasts of future development indicate that the upward trend will continue for years to come.
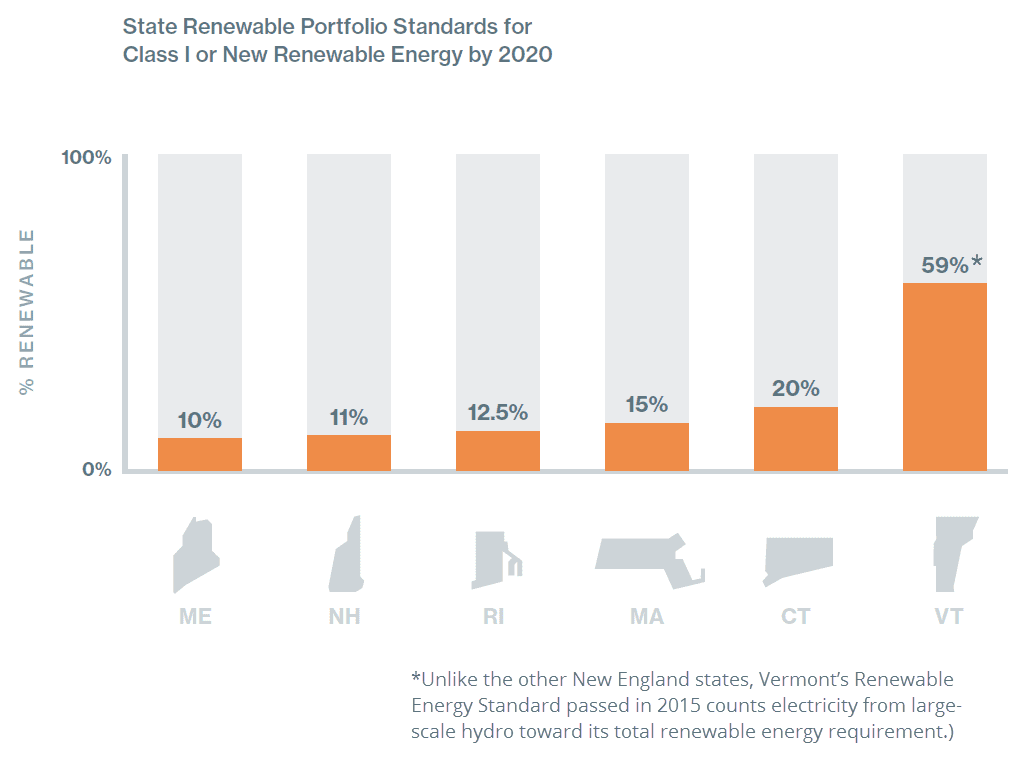
State policies, as well as state and federal support and tax credits, are spurring this remarkable growth, while falling technology costs are also helping. State Renewable Portfolio Standards, for example, require electricity providers to serve a minimum percentage of their retail customer load using renewable energy—see the chart below. This growth, particularly when combined with specific types of state support, is having a complex effect on the region’s wholesale electricity markets.
Energy efficiency: New England is leading the way
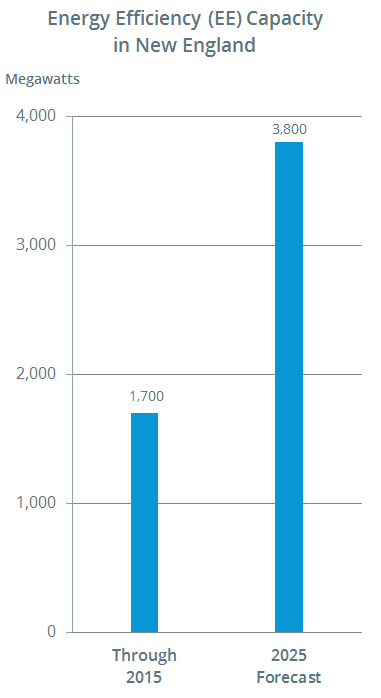 Capacity through 2015 includes EE resources participating in the Forward Capacity Market (FCM). EE in 2025 includes a forecast of incremental EE beyond the FCM. Sources: 2016 CELT Report and Final Energy-Efficiency Forecast Report for 2020 to 2025According to the US Environmental Protection Agency, “Improving energy efficiency is one of the most constructive and cost-effective ways to address the challenges of high energy prices,… air pollution, and global climate change.” New England is a national leader in EE policies, programs, and planning. The six states’ EE programs are ranked as some of the nation’s most ambitious by the American Council for an Energy-Efficient Economy. Massachusetts has been first in the nation since 2011, four New England states are ranked in the top 10, and all six states are among the top 20.
In 2012, ISO New England developed the nation’s first multi-state energy-efficiency forecast to capture the long-term effects of installed EE measures in commercial and industrial buildings and residential and multi-family homes with more efficient lighting, appliances, and heating, cooling, and ventilation equipment, as well as with energy management systems. The EE forecast is used in the annual long-term system planning process for meeting the region’s needs.
The 2016 EE forecast (to be published on the EE forecast webpage in early May) projects that from 2020 through 2025, EE measures will:
- Save the region 9,648 gigawatt hours (GWh) of energy—with an average annual savings of 1,608 GWh
- Shave approximately 1,284 megawatts (MW) of peak demand (the points of highest electricity use)—with an average annual peak reduction of about 214 MW. To ensure reliability, the region’s power system must be planned to meet peak demand, which represents a short time each day and a few days in winter and summer.
The ISO estimates that the states’ programs have spent over $3.5 billion from 2009 to 2014, and will continue to invest approximately $1.1 billion annually over the next decade. These investments are impacting energy use and demand in visible ways. When projected EE savings are factored in, energy consumption over the next decade remains essentially flat and growth in peak demand is dampened by more than 50% of normal growth. Several states, such as Massachusetts, have ambitious goals to reduce energy use by as much as 3% annually.
The savings are even greater after the region’s forecasted solar power is factored in, as these graphs show:
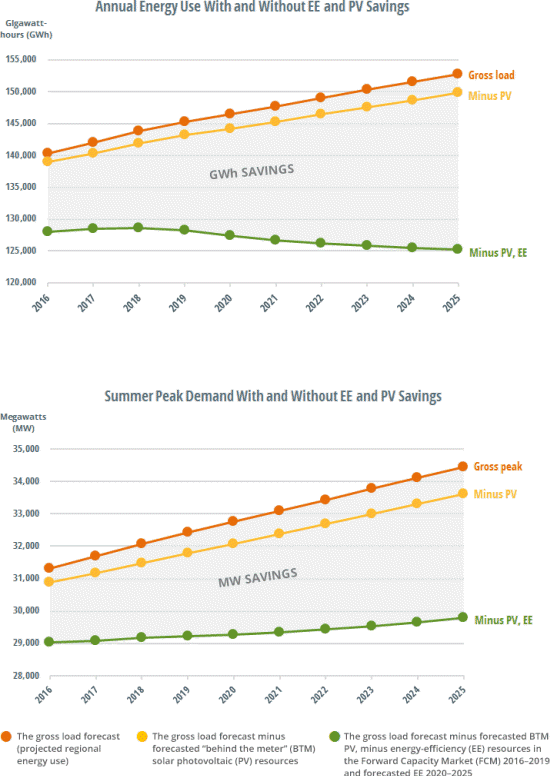
Note: Summer peak demand is based on the “90/10” forecast, which accounts for the possibility of extreme summer weather, such as an extended heat wave of about 94°F.
Source: Data from Final ISO New England Energy-Efficiency Forecast 2020–2025 and Final 2016 Solar PV Forecast Details (May 2016)
Solar power: a bright future
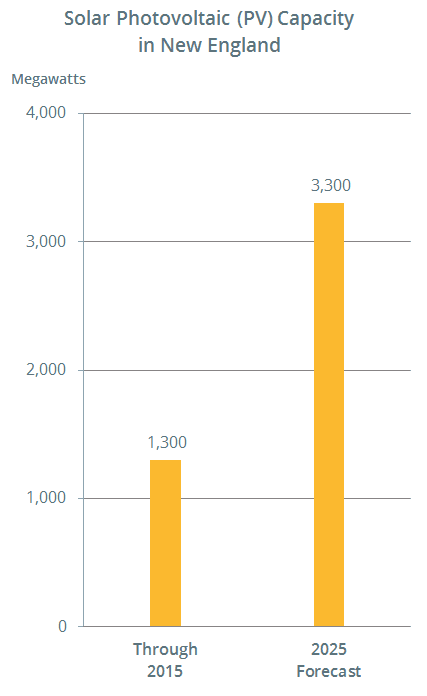 This chart reflects the ISO’s projections for nameplate capacity from PV resources participating in the region’s marketplace, as well as those connected “behind the meter.” Source: Final 2016 ISO-NE Solar PV ForecastSolar power is one of the fastest growing resource types in the region—it’s also a renewable, cleaner source of electricity. Despite the fact that the majority of solar photovoltaic (PV) installations are small (less than 5 MW), total nameplate PV capacity (the maximum amount of electricity a generator is capable of producing) was about 1,300 MW at the end of 2015. On paper, that amount is about equal to the region’s largest power plant. But a generator’s nameplate capacity and its measurable day-to-day performance differ significantly. This is particularly true for solar power, due to its weather-dependent nature.
The ISO formed the Distributed Generation Forecast Working Group (DGFWG) in 2013 to collect data on installed solar resources in New England and to help forecast future growth. This regional long-term PV forecast is another first in the nation. Similar to EE, the ISO uses the long-term PV forecast in its annual 10-year system planning process.
The 2016 PV forecast (to be published on the PV forecast webpage in early May) notes that by 2025, about 3,300 MW of nameplate PV is anticipated, which will produce about 4,200 GWh of annual energy.
Wind power is blowing in
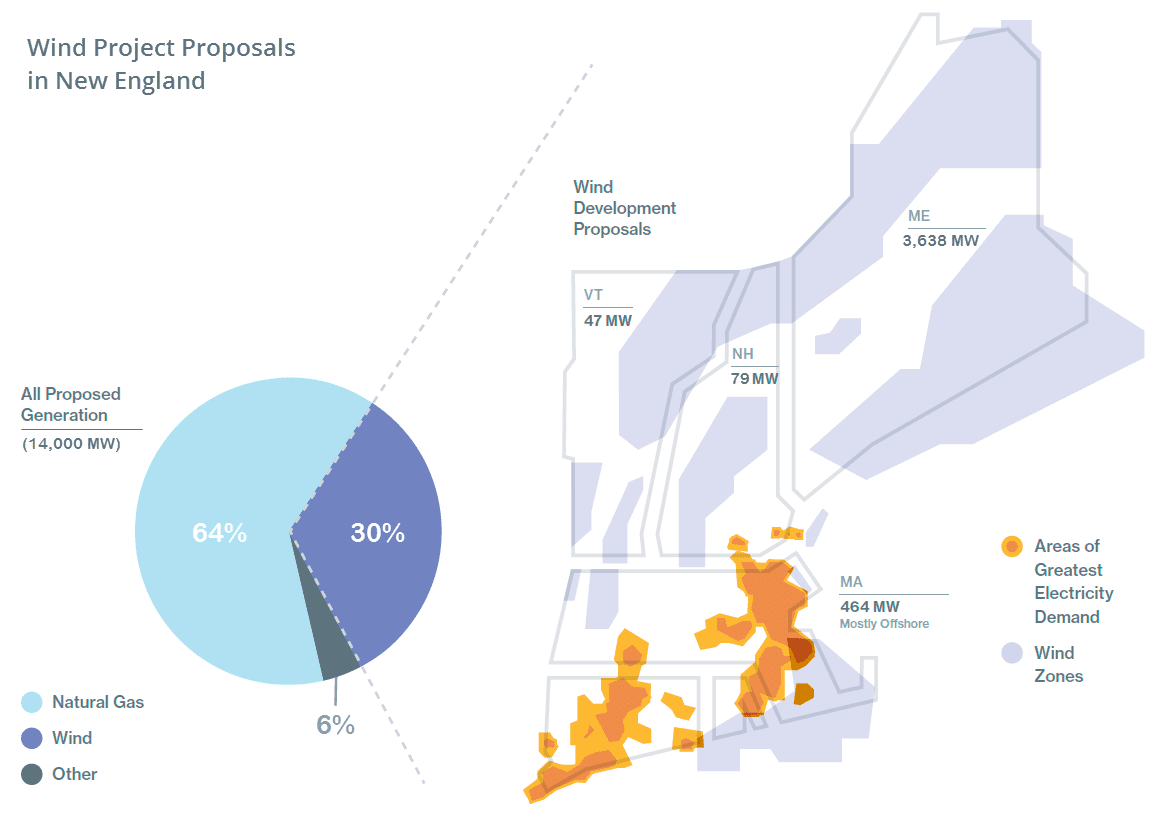
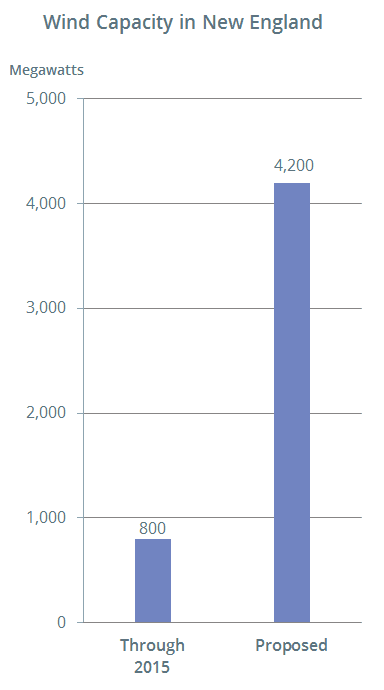 This chart reflects nameplate capacity of existing wind resources, as well as proposals in the ISO-NE Generator Interconnection Queue.Over 800 MW of nameplate wind capacity has already been interconnected to the grid, up from about 2 MW in 2005. And private developers are currently proposing building and interconnecting more than 4,200 MW of new wind resources—about 30% of all the proposed new power resources in the region. The ISO estimates that an additional 80 MW of wind resources are connected to the low-voltage distribution system.
In 2010, the ISO conducted the New England Wind Integration Study (NEWIS) to analyze how large amounts of wind energy could be integrated into New England’s power system operations without affecting reliability. Responding to study recommendations, the ISO implemented a centralized wind power forecast in January 2014 in phase one of its Wind Integration Project. This tool, which is exceeding accuracy expectations, gives ISO system operators and wind plant owners more granular information about when, where, and how much power can be expected from each large wind facility. This allows for better utilization of wind power and improves dispatch efficiency and system reliability. See the Seven-Day Wind Power Forecast, a public, aggregate forecast for the next seven days.
A major change to allow negative offers in the energy market in December 2014 also allows wind resources to be more competitive during times when there is excess generation on the system.
Working to integrate more renewable resources
In addition to its pioneering EE and PV forecasts, the ISO continues to actively pursue other initiatives and innovations that help integrate more renewable resources while ensuring the reliable operation of the grid.
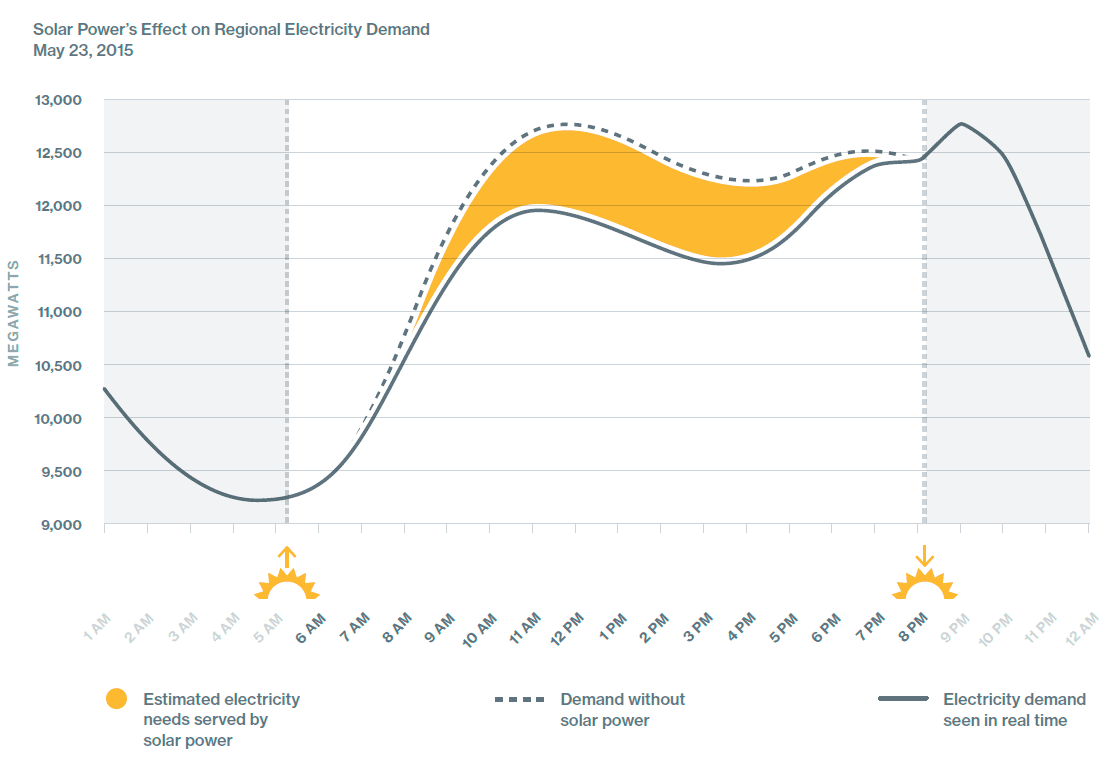
For example, the ISO is developing more sophisticated short-term forecasting tools to better anticipate real-time output from solar facilities. On clear, sunny days, more and more electricity demand is being offset from the regional power system by solar-powered resources, as shown below. According to ISO estimates, May 23, 2015 had New England’s highest total PV output through spring and summer 2015, with ideal conditions for PV production: a clear, relatively cool day near the summer solstice. The amount of demand that will be served by PV is hard to predict, however, because solar power is weather-dependent, plus most of the region’s solar power is connected “behind-the-meter,” making it invisible to the ISO operations in real time.
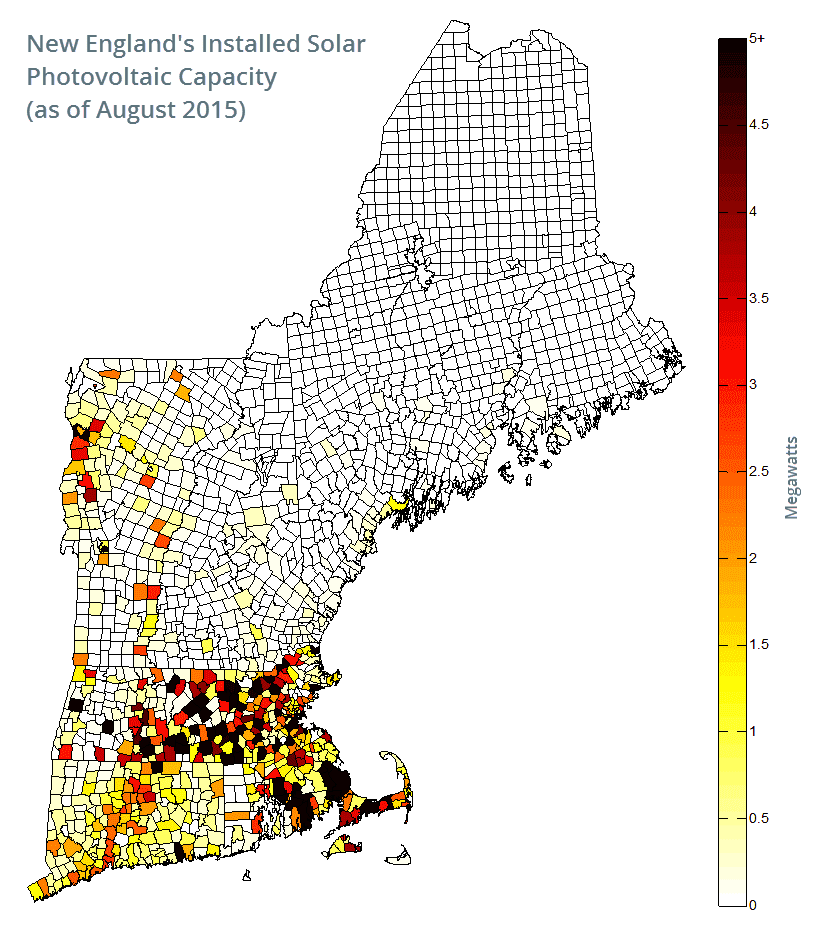
Understanding how much PV is installed and where it’s located is also critical to the ISO’s ongoing integration activities within both System Planning and System Operations.
 When it comes to fully harnessing New England’s significant onshore and offshore wind potential, the region will need investment in additional transmission infrastructure so that energy can be delivered to consumers.
Several ISO efforts are also underway to help the region get the most out of its wind-powered resources: We’re evaluating ways to speed up system impact studies for proposed wind generators in weak transmission areas. We’re revising modeling requirements, which should help reduce study times for new generators. And we’ve improved the processes for evaluating the interconnection of Elective Transmission Upgrades (ETUs). ETUs are transmission lines funded by private parties—not through regional cost-sharing.
 Source: ISO Generator Interconnection Queue (April 2016; FERC jurisdictional proposals only)
Reliably and cost-effectively integrating weather-dependent resources drove some of the ISO’s most innovative work in 2015. The Do Not Exceed (DNE) Dispatch Project, expected to go live mid-2016, will among other things incorporate wind and other intermittent resources into real-time dispatch. This project incorporates the ISO’s pioneering application of a powerful risk-management modeling tool that yields both increased power system reliability and minimized dispatch costs for a sizable savings.
Learn more
- Read about the challenges involved in the integration of renewable resources and other new technologies.
- Get key statistics on New England’s electricity use and resource mix.
- Track the regional “fuel mix” in real time via ISO Express.
- Emerging energy-storage technologies hold great potential for helping to balance the weather-dependent output from the growing number of wind- and solar-powered resources in New England. Read more in “New energy-storage options emerging in New England; ISO-NE publishes primer on market participation.”
- Categories
- Industry News & Developments
- Tags
- energy efficiency, environment, forecast, renewable resources, solar, wind