Regional air emissions 2017: long-term reduction trends continue

Since 2001, SO2 down 98%, NOx down 74%, CO2 down 34%
Note: This article was updated following the publication of the final 2017 ISO New England Electric Generator Air Emissions Report.
Regional emissions of sulfur dioxide (SO2), nitrogen oxides (NOx), and carbon dioxide (CO2) declined in 2017 compared to the previous year, according to data compiled for the 2017 ISO New England Electric Generator Air Emissions Report. The lower emissions were due largely to a decline in electricity generation by power plants that use fossil fuels. The year-over-year declines continued long-term reductions in the emissions produced by New England power plants.
Year-over-year changes: 2017 vs. 2016
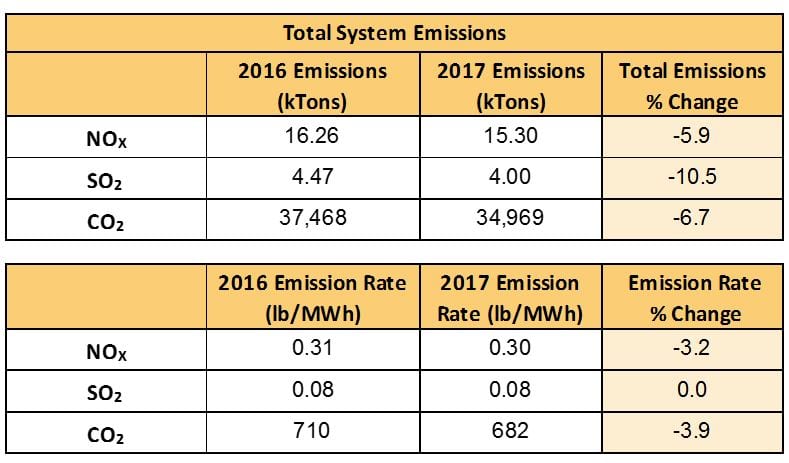
The tables below summarize the changes for total system emissions (the amount of system emissions) and emission rates (the pounds of emissions given off, on average, with every megawatt-hour (MWh) of electricity produced) from 2016 to 2017. This is akin to comparing how many gallons of gasoline a car used versus its miles per gallon (MPG). Total emissions declined in 2017 for SO2, NOx, and CO2 . Emission rates for NOx and CO2 also fell, while SO2 emission rates remained flat.
2016 and 2017 New England system emissions (ktons) and emission rates (lb/MWh)
Several key factors contributed to the year-over-year declines:
- Continuing declines in coal- and oil-fired generation—Relatively warm winter temperatures in the first quarter of 2017 contributed to decreases in generation from coal and oil resources. Coal generation fell by 870 gigawatt-hours (GWh), or 34%, while oil generation fell by about 150 GWh, or 16%. Natural gas generation also declined, by about 5% or about 2,500 GWh. On the other hand, nuclear generation, a source of zero emissions, declined by 1,207 GWh, or 4%.
- Lower demand, and lower energy generation—Overall, generation in New England was 2.8% lower in 2017, at about 102,562 GWh. That paralleled a 2.6% decline in total demand for power, at about 121,220 GWh in 2017, due to a cooler summer and warmer winter when compared to 2016.
- Significant increases in production from hydro, solar, and wind resources—Non-emitting grid-scale solar and wind resources together increased production by 995 GWh, or 31%. Generation by hydro facilities rose 1,112 GWh, or 15%.
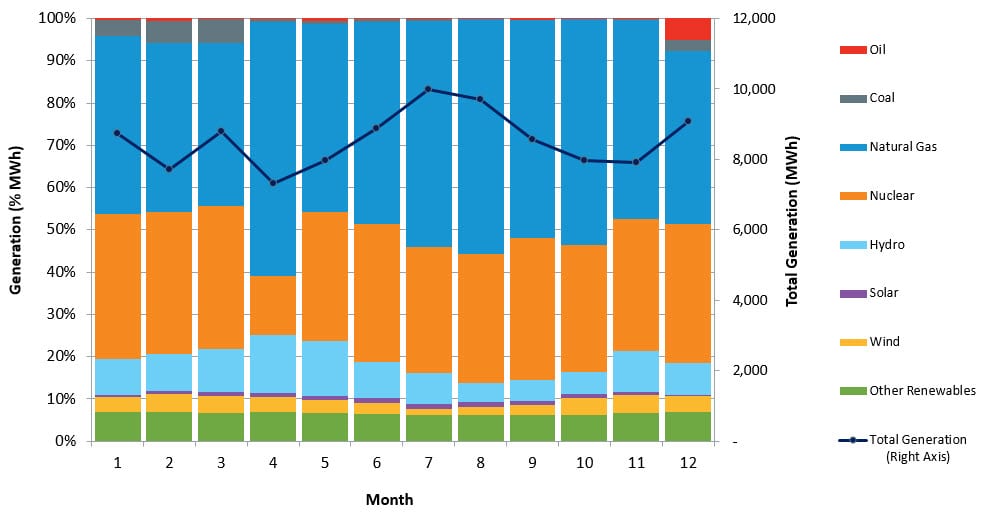
The chart below shows each fuel type’s monthly contribution as a percentage of the total. Note the increase in generation by oil-fired generators in December. An extreme cold spell that hit during the last week of December 2017 required extensive generation by oil units.
2017 ISO New England monthly generation by fuel type (% GWh)
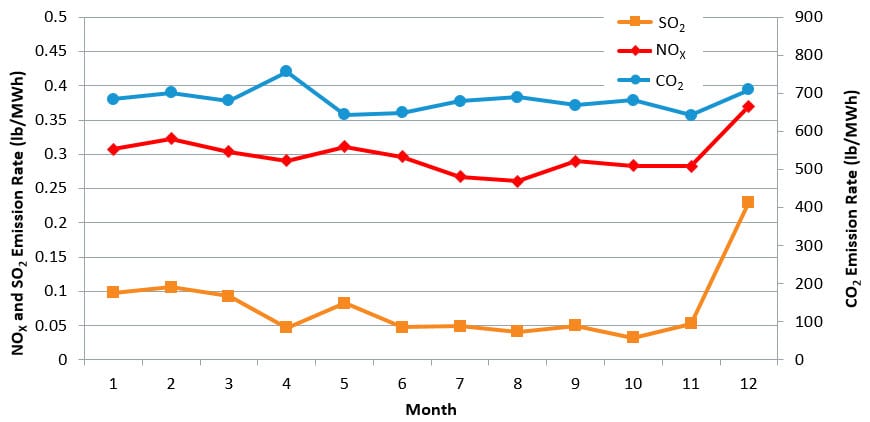
The next chart shows that the rate of emissions per megawatt-hour of generation rose in December as a result.
2017 Average Monthly Emission Rates (pounds per megawatt-hour)
Long-term trends: 2001–2017
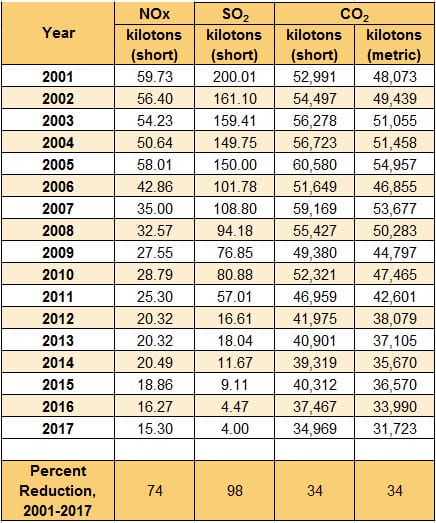
Total emissions for SO2 and NOx declined from 2001 to 2017 by 98% and 74%, respectively, while CO2 emissions fell by 34%. The table below shows the total amount of air emissions on an annual basis in kilotons (kTons).
Annual Emissions of NOX, SO2, and CO2, 2001 to 2017 (kilotons)
A shifting fuel mix
The type and magnitude of a generator’s emissions are directly linked to the type of fuel that powers it, and the fuel mix used to produce New England’s electricity has changed significantly over the past decade.
Percentage energy generation by fuel type, 2008 compared with 2017
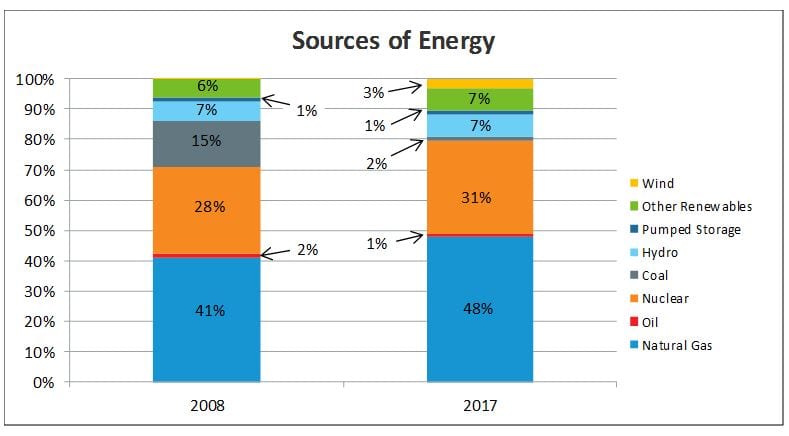
Natural gas-fired resources account for the vast majority of new generators built in New England since 1997. This ongoing trend to meet electricity needs with higher-efficiency, lower-emitting gas-fired generators instead of oil- and coal-fired generators has been the biggest contributor to the long-term decline in regional emissions. Transmission system upgrades have further reduced the need to run older, less efficient oil and coal units.
The region’s increasing development of wind, solar, and other zero-emission resources will further contribute to reducing greenhouse gases. As of April 2019, about 57% of all proposed projects in the generation interconnection queue were wind-power resources.
More imported electricity
Since 2004, lower-priced electricity from outside New England has increasingly flowed in to serve regional demand. This external generation, which served 17% of New England’s energy needs in 2017, doesn’t count toward regional air emissions.
Less demand for electricity from the regional power system
Since about 2005, annual regional demand for wholesale electricity has been declining, and with it, so has electricity generation. The 2008 economic recession and slow recovery have dampened electricity consumption, but several other, long-term factors have also been at work reducing the amount of power consumers pull from the New England grid:
- Energy-efficiency (EE) investment—The New England states are national leaders in implementing EE measures, such as the use of more efficient lighting, appliances, cooling, and building operation. These EE programs are having a noticeable effect. The ISO’s EE forecast projects the nearly $1.2 billion that the states will invest annually, on average, from 2020 to 2028 will save an average of 1,940 GWh each year for the region. EE measures will reduce summer peak demand, the period of highest electricity usage, by about 273 MW annually.
- Demand resources—Like power plants and other supply resources, demand resources are competitive assets that help meet New England’s electricity needs. But instead of generating power, they reduce the amount of power they’d normally pull from the grid. EE measures are an example of passive demand resources, while active demand resources include practices like powering down machines or switching to an on-site generator. (Learn more.)
- Distributed generation—The growth in small-scale solar power systems—more than 157,000 as of December 2018—shows that more and more New Englanders are supplying some or all of their own power, thereby reducing demand for electricity from the regional grid. The ISO’s forecast of regional solar photovoltaic (PV) power predicts that behind-the-meter PV energy production will more than double by 2028.
The 2017 generator air emissions report is based on data from the US EPA Clean Air Markets Database, NEPOOL Generator Information System (GIS) monthly data, the US EPA’s latest eGRID database, or assumed emission rates based on unit type and age.
- Categories
- Industry News & Developments
- Tags
- energy efficiency, environment, natural gas, new england states, oil, renewable resources, solar, wind