Checking in on consumer demand during the pandemic

The COVID-19 pandemic has changed many things about life in New England, including the way residents and businesses use electricity. In a follow up to an ISO Newswire Q&A from March, Mike Knowland, ISO New England’s Manager of Forecast and Scheduling, again discusses what his Forecasting team is seeing on the power system and how things have changed over the past five months.
We’re several months into the pandemic. What changes have you noticed in consumer demand as the seasons have changed?

When government and societal actions to slow the pandemic began in mid-March, we noticed an average decline in overall electricity use of about 3 to 5 percent. We assumed that residential electricity use was up, and those increases were more than offset by decreases in the commercial and industrial sectors. This trend continued throughout the spring.
In early summer, our forecasters were essentially seeing a predictable usage trend based on weather in the region. On hot, humid days, demand is equal to or higher than what we would have expected without the pandemic. On more mild days, demand is still lower than expected. As the summer continued on, there were fewer mild days and the overall load was fairly consistent with expected summer electricity demand.
So demand is actually higher than expected during hot weather?
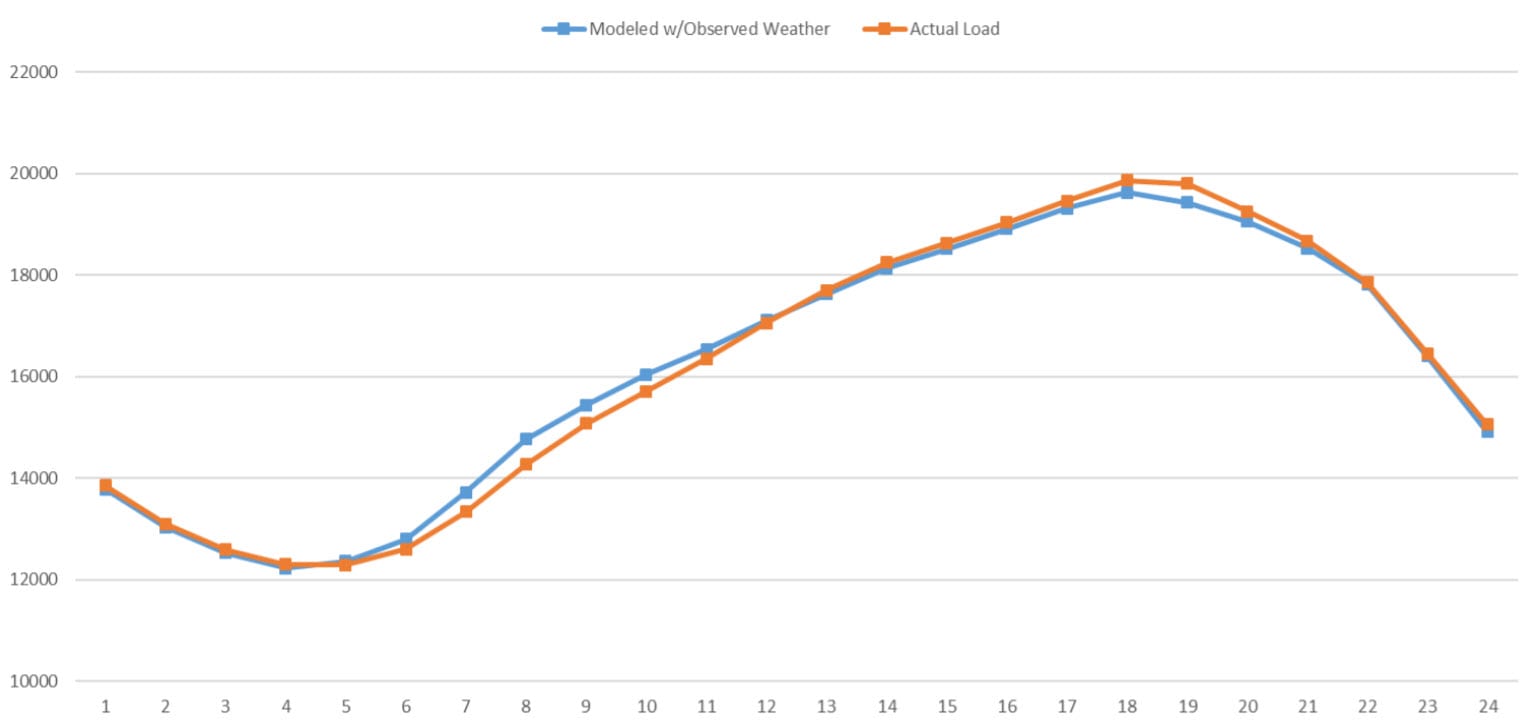
Yes. While the morning ramp up of usage is still slower, peak demand on hot, humid days is sometimes higher than it would have been without the pandemic. These observations are shown in the graph below, which plots average hourly consumer demand in July. This higher demand is likely due to increased home air conditioning, coupled with offices and other commercial properties re-opening, albeit with smaller numbers of employees.
Average Load Curve, July 2020
Has forecasting demand become easier as the pandemic has gone on?
Every day we learn more about the pandemic’s impact on demand, which helps us moving forward in forecasting. At the start of the pandemic, we had no comparable data available to help us navigate this new situation. Every new season presents another set of challenges and now there is nearly five months of information to draw from. While this doesn’t compare to the years of historical data we usually rely upon, it is helping. Summer is coming to a close soon and the change in weather pattern, coupled with the changes that have occurred in re-opening plans, will again present new challenges to demand forecasting.
The ISO continues to stay in touch with system operators in other parts of the country to hear what they’re experiencing and how it might apply in New England, as well as sharing our experiences with them.
How can people stay up-to-date on these trends?
Since mid-May, the ISO has have published a weekly update on how actual consumer demand in the region has compared to what we would have expected absent the pandemic. We have also published a reference guide for how to read and use the data in these reports.
- Categories
- Inside ISO New England
- Tags
- covid-19, forecast