Earth Day 2018: Setting regional solar and wind power records in New England

This Earth Day (Sunday, April 22)—or any day—you can learn about the role that renewables and other clean-energy resources are playing in the region by visiting ISO New England’s Key Grid and Market Stats and Grid in Transition webpages. Following are some snapshots of where the region stands, with links to learn more.
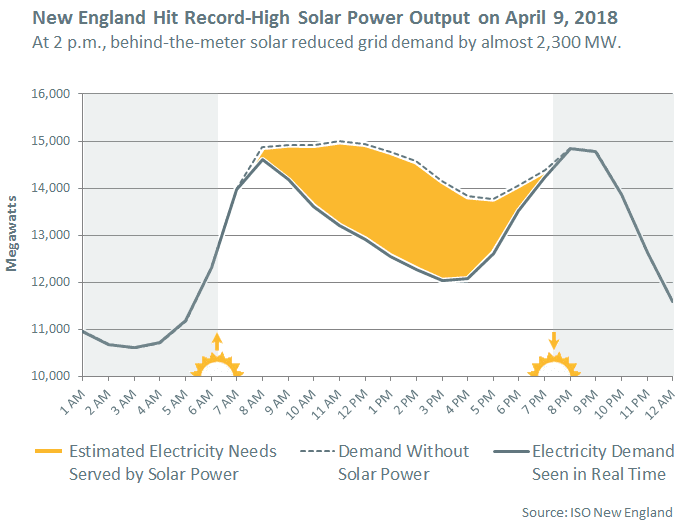
Solar power and wind power are breaking regional records
Over 130,000 solar power installations now span the six New England states, totaling about 2,400 MW (nameplate)—over 5,800 MW are expected by 2027. Almost all this solar power is connected to local distribution utilities or “behind the meter” (BTM) directly at retail customer sites. The ISO can’t dispatch BTM solar power. Instead, we see the impact as a reduction in power system demand, and when conditions are right, it can be a significant reduction, indeed. On April 9, a cool, cloudless day across New England, BTM solar power set a new regional record. As illustrated below, at 2 p.m., demand was almost 2,300 MW lower than it would’ve been without BTM solar output (based on preliminary data). With more and more solar power coming on line every day, look for this record to keep breaking. Learn more in Solar Power in New England: Concentration and Impact.
Wind power is coming on fast, too, with 1,400 MW already installed and over 8,000 MW more proposed regionally, on- and offshore. In fact, proposed new wind projects eclipsed proposed new natural-gas-fired generation for the first time in 2017. Delivering more onshore wind to far-away consumers will require major transmission system upgrades, though, because of the large distances from some projects to the existing grid. When it comes to actual output, the region exceeded 364 GWh of monthly wind power in January (based on preliminary data), breaking the regional record of 358 GWh last March. As with solar power, though, this record will likely be short-lived.
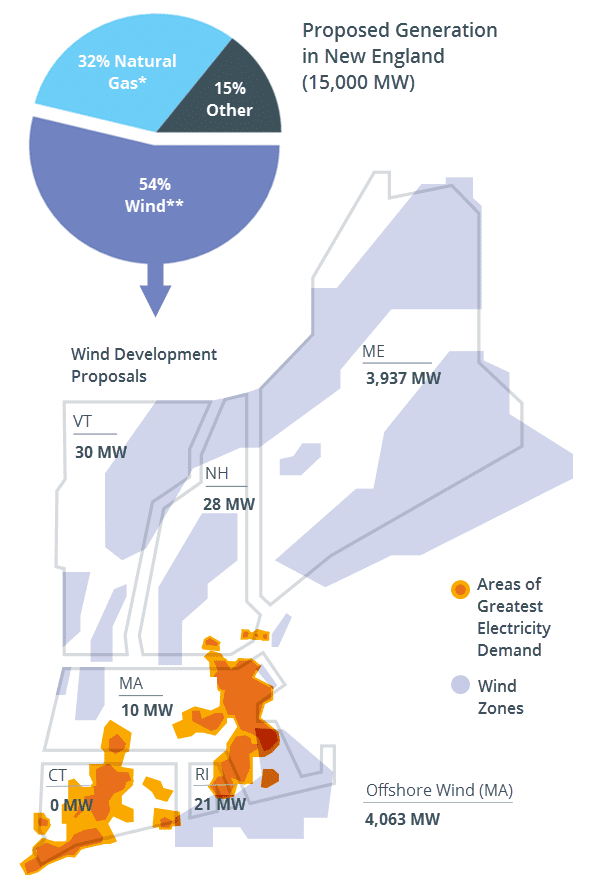
*Some natural-gas projects include dual-fuel units (typically oil).
**Some wind projects include battery storage.
Source: ISO New England, ISO Generator Interconnection Queue (April 12, 2018)
The region leads in energy-efficiency measures to reduce electricity demand
|
New England claims several top spots in the American Council for an Energy-Efficient Economy’s State Energy Efficiency Scorecard.
|

In addition to helping drive solar and wind power installations, the New England states have also been investing heavily in energy-efficiency (EE) programs, which are hailed by the US Environmental Protection Agency as “one of the fastest, most cost-effective ways to save money, reduce greenhouse gas emissions, … [and lower] overall electricity demand, thus reducing the need to invest in new electricity generation and transmission infrastructure.”
The projected demand-reducing effects of EE, as well as PV, are illustrated in the graphs below. The ISO developed the nation’s first multi-state energy-efficiency and solar PV forecasts in 2012 and 2014, respectively, to capture these effects and updates them annually. Learn more on Key Stats: Electricity Use.
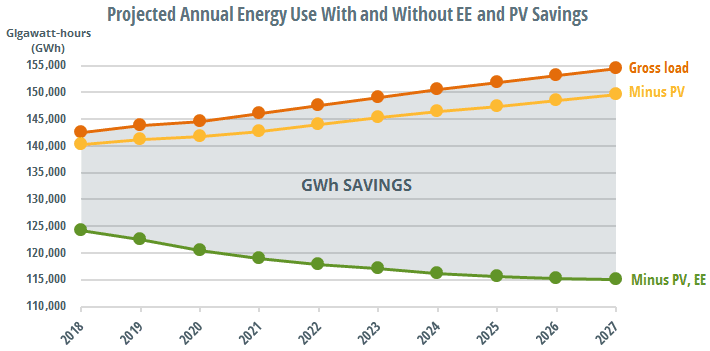 |
 The gross load forecast (projected regional energy use) The gross load forecast (projected regional energy use) |
 The gross load forecast minus existing and anticipated behind-the-meter (BTM) The gross load forecast minus existing and anticipated behind-the-meter (BTM) solar photovoltaic (PV) resources |
 The gross load forecast minus existing and anticipated BTM PV The gross load forecast minus existing and anticipated BTM PV and energy-efficiency (EE) resources |
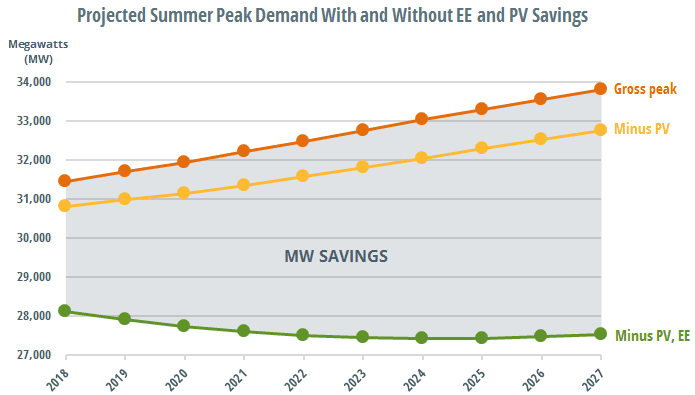 |
| Note: Summer peak demand is based on the “90/10” forecast, which accounts for the possibility of extreme summer weather, such as an extended heat wave of about 94°F. |
| Source: ISO New England, Draft 2018 CELT ISO-NE and States Annual Energy and Seasonal Peak Forecasts (March 2018) |
It’s unclear how long this downward trend will hold, though. If the transportation and heating sectors are electrified as part of the New England states’ decarbonization efforts, grid demand could start to tick up. The ISO is watching out for the possible increased adoption of electric vehicles (EVs) across the region and the greater use of electric heating. Vehicle manufacturers are also moving aggressively to include EVs in their product portfolios by the early 2020s. If rapid EV or electric heating adoption emerges, the impacts may need to be considered in the ISO’s outlook for the region’s demand and energy. The ISO plans to start working with regional stakeholders to quantify the impact of the states’ decarbonization policies on long-term demand so that we can understand their potential effects on the power system and reflect these in future Regional System Plans.
Lower-emitting sources already fuel most of the region’s generation, and the future is looking even cleaner and greener
In 2017, natural-gas-fired generation, nuclear, other low- or no-emission sources, and imported electricity (mostly hydropower) provided roughly 99% of the region’s electricity, and these resource types are projected to continue growing rapidly. And while only about 16 MW of grid-scale battery storage had achieved commercial operation regionally by late 2016, over 560 MW more are currently vying for interconnection. As more new power resources come on line, they’re hastening the retirements of the region’s older and less-efficient generators, many of which are high-emitting coal- and oil-fired plants.
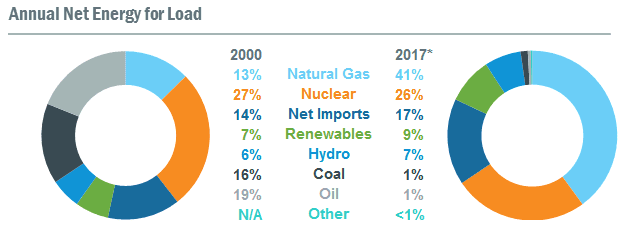 |
| * Data are subject to adjustments. Totals may not equal 100% due to rounding. |
| ** “Other” represents resources using a fuel type that does not fall into any of the existing categories and may include new technologies or fuel types without sufficient quantity to have their own category. |
| Source: ISO New England, Net Energy and Peak Load by Source Report |
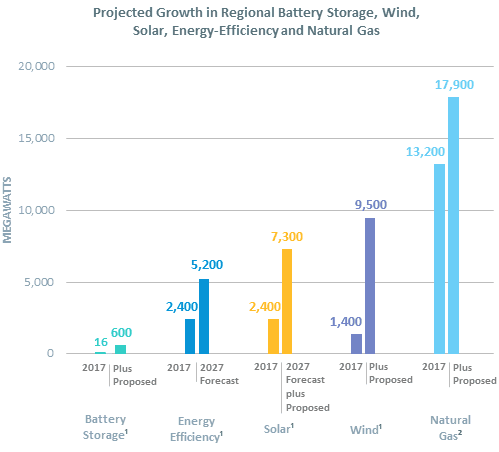 |
| Notes: Numbers are rounded. Not all proposed new projects are built; historically, almost 70% of proposed new megawatts in the ISO Generator Interconnection Queue have ultimately withdrawn. |
| 1 Nameplate capacity. Battery storage includes existing and proposed grid-connected resources; additional battery storage may be counted with the wind and solar projects they’re affiliated with. Energy-efficiency includes resources participating in the capacity market, as well as forecasted future capacity. Solar power includes existing and proposed grid-connected resources, as well as existing and forecasted behind-the-meter resources. |
| 2 Nameplate capacity for proposed projects; summer seasonal claimed capability for existing units based on primary fuel type. Does not include oil units that can switch to natural gas. |
| Sources: ISO New England, ISO-NE Generator Interconnection Queue (April 12, 2018), Draft 2018 ISO-NE Solar PV Forecast, Draft Energy-Efficiency Forecast Report for 2022 to 2027, and Seasonal Claimed Capability Monthly Report (January 2018) |
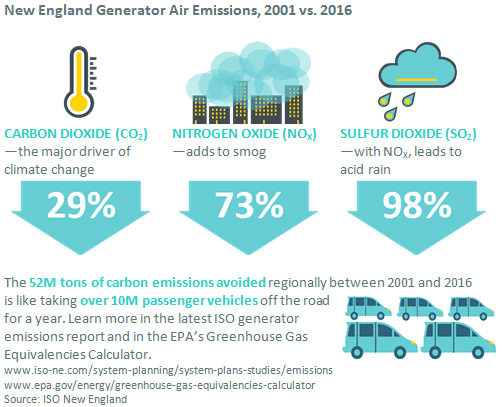
Air emissions have fallen dramatically
The shift to cleaner, more efficient generation has been facilitated by New England’s competitive wholesale electricity markets, aided by tough environmental regulations and strong regional investment in transmission improvements. The results are striking when annual generator air emissions are compared between 2016 and 2001:
|
Collaborative efforts succeeding on solar power “ride-through” The ISO’s planning efforts have revealed that much of the region’s solar power isn’t set up to ride through sudden changes in power system voltage or frequency that can be caused when a transmission line or generator trips off line. Instead, it may automatically disconnect. If a large amount of solar power was to shut down suddenly, net demand on the regional grid would spike, potentially introducing instability. (Read about how California suddenly lost nearly 1,200 MW of solar power in a 2016 incident.) To prevent this, the ISO has been working with the New England states, distribution utilities, and standard-setting bodies on stricter ride-through requirements for future solar interconnections. Four states so far—including Massachusetts, with over 60% of the region’s solar power—have agreed to adopt the ISO’s interim standards. |
The ISO is working hard to integrate more renewable resources
Modifying the power system and markets to accommodate large amounts of renewable resources and other new technologies while ensuring the reliable operation of the grid remains an ongoing process—one that means adjustments across nearly every aspect of our business. Here’s a small sampling of the recent initiatives and sometimes pioneering new approaches we’ve taken to help the region keep pace with rapidly changing technologies:
- “ISO-NE, NEPOOL, and PTO AC make joint filing regarding the interconnection clustering methodology”—an enhancement to expedite new wind projects, as well as new transmission projects to help deliver more renewable energy
- Price-Responsive Demand (PRD) Project—project which will complete full-integration of demand resources in June
- “ISO-NE files proposal to harmonize competitive markets and state-sponsored resources”—recent changes to the capacity market that will help accommodate more publically funded clean energy
- “ISO-NE Incorporates Wind-Powered Resources into Real-Time Dispatch with Do Not Exceed Dispatch Project”
- Working toward a Smarter, Greener Grid
- Categories
- Industry News & Developments
- Tags
- energy efficiency, energy storage, environment, forecast, renewable resources, solar, wind