How a Patriots Super Bowl affects the region’s power grid
 The New England Patriots are back in the Super Bowl, set to take on the Atlanta Falcons Sunday night in Texas. Millions of football fans across the region will be watching, and so will ISO New England system operators—not to cheer on the home-town favorite, but to ensure the region’s power grid reliability. Even when the game is thousands of miles away, the Super Bowl can have a big impact on regional electricity demand—before, during, and after the game. Like players celebrating in the end zone after a touchdown, demand spikes and dips throughout the game. Grid operators must closely monitor the fluctuations and be ready to respond quickly. Electricity supply must be kept in precise balance with consumer demand at all times—and failure to do so could result in grid instability.
Operating the grid
One of ISO New England’s key functions is the daily reliable operation of the high-voltage power system, a six-state network of 9,000 miles of high-voltage transmission lines and more than 350 generators. To do this, the ISO works with generation and transmission companies to make sure that enough electricity is available for New England consumers at all times. ISO Forecasters and other staff work around-the-clock to create and update a variety of demand, or “load,” forecasts. These short-term forecasts help us decide how many megawatts (MW) of electricity will be needed for a given week, day, or hour, and help us to manage the grid reliably through cold temperatures in the winter, high temperatures in the summer, holidays, and even Super Bowl games.
Factors that affect demand
ISO New England forecasters first consider the weather, which is the most significant factor driving demand for electricity. Temperature, dew point, precipitation, cloud cover, and wind can have a dramatic effect on consumer demand for lighting, air conditioning, and heating. The ISO uses outlooks provided by three different weather forecasting organizations to compile its weather forecast.
Historical data are also a factor in determining demand on a given day. This is especially true when forecasting for special holidays or high-profile sporting events that draw a large television viewing crowd. This information is gathered from a database that searches for similar days in operational history. For example, to forecast demand for the big game on Sunday, forecasters look at consumer demand trends from past Super Bowls; this year they’ll be looking closely at the February 1, 2015, electricity demand profile, which is the last time the Patriots played in the Super Bowl.
Comparable days are analyzed and updated to account for factors such as population and economic growth. The day of the week and information regarding the previous day’s weather and demand are also taken into account. Once this information is compiled, Forecasters publish the expected hourly system demand for the remainder of the current day and the next two days. The Forecasters monitor the many variables that go into creating the forecast and, as conditions change, update their reports as needed.
Because generators are scheduled to run based on the load forecast, having accurate forecasts is imperative to ensuring that the appropriate amount of generation is online or available to meet the demand at any given second.
Football’s impact on the grid
The graphs below depict electricity demand during that past two Super Bowls, one featuring the Patriots (in red) and the other not (in orange). An event as large as the Super Bowl syncs up the actions of a majority of people in New England, and because of this, electricity consumption spikes and dips throughout the game. Though colder weather in 2015 increased overall demand for electricity, the patterns between during the two days remain consistent. For example, both Super Bowl load curve shows an uptick in demand that coincides with half-time, during commercials, and at the end of the game. These spikes are unique to the Super Bowl and happen because people likely are taking actions that increase electricity use, such as using the oven or microwave, opening up refrigerators, and water systems across the six states operating at virtually the same time—for all the obvious reasons! When the Patriots play, these spikes and dips are even more pronounced, as more casual football fans find themselves watching the game.
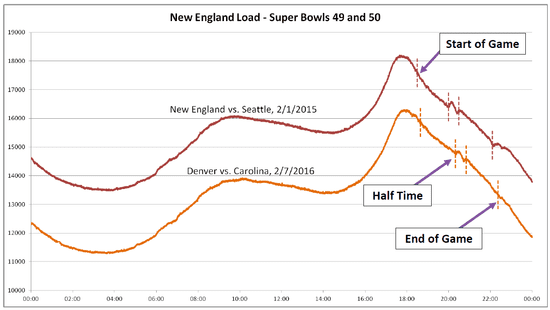
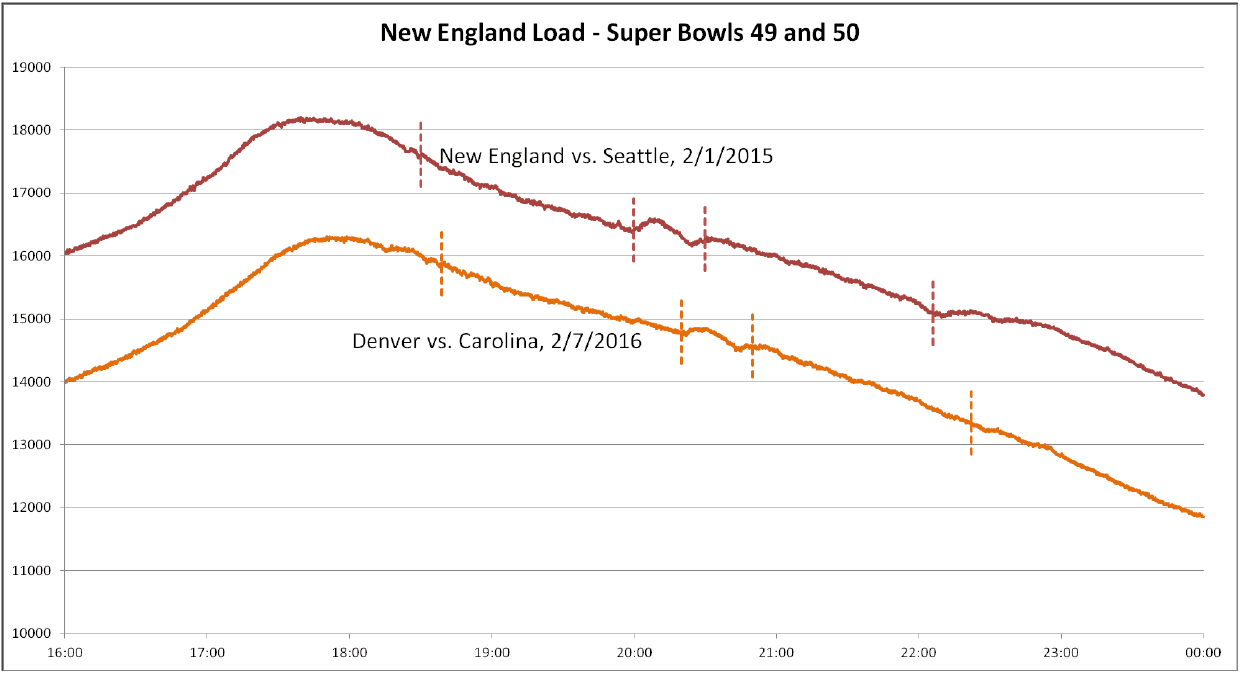
You can keep an eye on these spikes and dips in real time on the ISO homepage, in ISO Express, or on our mobile app ISO to Go.
- Categories
- Industry News & Developments
- Tags
- forecast, system operations