Summer 2016 recap: Uneventful, until August
 Summer 2016 was fairly uneventful until August arrived with its long stretches of hot, humid weather that pushed up demand for air conditioning and the electricity that powers it. Despite a high number of unexpected resource outages on one August day, ISO New England’s control room operators were able to operate the power system reliably that day and throughout the summer.
August heat wave
During a mid-August heat wave, the steamy weather and unexpected resource outages created a shortage of reserves for several hours on Thursday, August 11. Sweltering heat pushed up demand, even as the power system lost nearly 4,300 MW of resources that dropped offline unexpectedly over the course of the day. A large number of resources tripped offline in the morning, causing the ISO to implement Master/Local Control Center Procedure No. 2 at 10:30 a.m. That’s a precautionary measure requiring market participants to cease non-emergency maintenance and repairs that could affect the reliability of the power system.
As the day progressed, demand continued to rise and more generators became unavailable. To handle the rising demand and continuing forced outages, ISO New England implemented two actions of its Operating Procedure No. 4 to remedy a capacity deficiency and keep the power system operating reliably. At 1:50 p.m., ISO New England declared an operating reserve deficiency, allowing the ISO to operate the system with reduced reserves. At 2:25 p.m., the ISO dispatched approximately 190 MW of demand-response resources—companies that agree to reduce their power use when called on by the ISO—in all of New England, with the exception of Maine. Preliminary figures indicate that the demand-response resources provided a reduction in demand of about 183 MW, for a response rate of about 96%. The demand-response reduction was ended at 6:30 p.m., and Operating Procedure No. 4 was cancelled at 7:30 p.m.
In competitive markets, reserve shortages are expected to push prices up, and that happened for short periods during the August 11 capacity deficiency. During two five-minute intervals (from 2:50 to 3:00 p.m.), wholesale power prices spiked to $2,690.60 per megawatt-hour (MWh). New England’s wholesale markets produce prices every five minutes in real time but are settled on hourly averages, so the highest hourly average during the day was $1,438.97/MWh for the hour from 2 to 3 p.m. The average price for the entire day was $254.97/MWh and the average real-time price of wholesale electricity for the month of August was $40.19/MWh.
Demand peaked on August 11 during the hour from 4 to 5 p.m. at 25,037 MW.* The following day, on Friday August 12, the heat wave continued and demand peaked during the hour from 2 to 3 p.m. at 25,521 MW, which stands as the peak demand for the year. While demand was higher on August 12, power plants on the regional power system were able to generate sufficient electricity to meet consumer demand plus the required levels of reserves.
Third-highest weekend peak
Two days later, on Sunday August 14, with continuing heat and humidity, New England scored the third-highest peak demand on a weekend day at 24,017 megawatts (MW) during the hour from 5 to 6 p.m. In New England, the record for the highest peak demand on a weekend day was set on Saturday, July 20, 2013, at 24,668 MW, with the second-highest weekend day coming in at 24,065 MW on Saturday, August 13, 2005. The highest overall peak demand in New England occurred on Wednesday, August 2, 2006, at 28,130 MW.
Fuels used during system stress
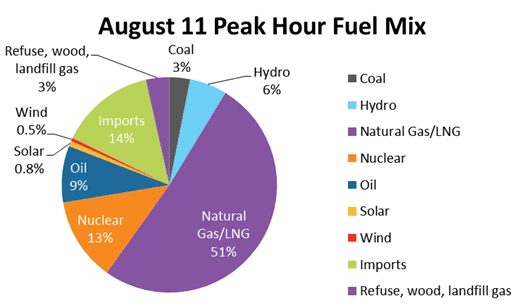
On August 11, during the peak hour from 4 to 5 p.m., natural gas provided 51% of the electricity generated within New England, imports from New York, New Brunswick, and Quebec provided 14%, nuclear provided 13%, and oil and coal provided 12%.* The fuel mix chart for the hour of peak demand illustrates that the region still must depend on oil and coal resources during periods of high demand or system stress.
June and July
The month of June stood out for its milder-than-normal weather, resulting in very low energy consumption and very low natural gas and wholesale power prices. Total energy consumption during June 2016 was the second-lowest of any June since 2000, at 10,136 gigawatt-hours (GWh). Natural gas prices came in at the sixth-lowest monthly average price in New England, at $2.14 per million British thermal units (MMBtu), and the average monthly wholesale power price was the third-lowest since 2003, at $21.24/MWh. In fact, the relatively mild weather in New England since February 2015 (which was the coldest month in New England since at least 1960) has meant moderate demand for both natural gas and electricity, and low wholesale power prices as a result. The low prices during June 2016 illustrate that when New England power plants can access the vast supply of lower-priced, domestic natural gas being produced in the Marcellus shale deposit, power prices are low, on average.
The month of July, while hotter than normal, did not stand out in terms of power usage or prices.
Summer 2016 degree days
Cooling and heating degree days can help quantify and compare temperatures over a period of time. A degree day is a measure of heating or cooling. A zero degree day occurs when no heating or cooling is required; as temperatures drop, more heating days are recorded; when temperatures rise, more cooling days are recorded. The base point for measuring degree days is 65 degrees. Each degree of a day’s mean temperature that is above 65 degrees is counted as one cooling degree day, while each degree of a day’s mean temperature that is below 65 degrees is counted as one heating degree day. For example, a day’s mean temperature of 90 degrees equals 25 cooling degree days, while a day’s mean temperature of 45 degrees equals 20 heating degree days.
| Summer 2016 |
Cooling degree days (CDD) | Normal CDD for the month | Percent deviation from normal |
|---|---|---|---|
| June | 17 | 50 | -67% |
| July | 130 | 114 | +15% |
| August | 143 | 101 | +42% |
*These peak demand and fuel mix numbers are derived from meters that provide the revenue-quality data used to calculate charges and credits in the wholesale energy market. That revenue-quality data only becomes available after the operating day and includes settlement-only generators whose output is not available to the ISO in real-time. The peak demand and fuel mix information relied upon by the ISO control room staff to manage the power system in real-time is cited in several ISO reports (including the Chief Operating Officer’s report to the NEPOOL Participants Committee) and will vary from the revenue-quality metered data.
- Categories
- Industry News & Developments
- Tags
- peak demand, summer, system operations